SDatta Dashbaord
Turning AI predictions into trusted decisions
Turning AI predictions into trusted decisions
match AI with daily supply chain operations
match AI with daily supply chain operations

My Role
My Role
My Role
Design Lead
Design Lead
Design Lead
Timeline
Timeline
Timeline
Q4 2023-Q3 2024
Q4 2023-Q3 2024
Q4 2023-Q3 2024
Team
Team
Team
1 Designer, 3 Data Scientist , 2 DevOps, CTO, CEO
1 Designer, 3 Data Scientist , 2 DevOps, CTO, CEO
1 Designer, 3 Data Scientist , 2 DevOps, CTO, CEO
Overview
Overview
My Role
Led product strategy and designed the UI/UX for the company's first product from
0→1, working with the founding team to transform static Excel exports into an interactive dashboard.
The Problem
Forecasts were based on outdated, unrelated calculations. The transformation to AI-powered predictions was crucial to catch expensive problems before they occurred.
The Challenge
How do you take an AI algorithm that users don't trust because it's a 'black box' and fear it will replace them — and turn it into an everyday tool?
Impact
Served 10+ early customers
Reduced analysis time from days to minutes
Enabled daily decision-making with interactive forecasts
My Role
Led product strategy and designed the UI/UX for the company's first product from
0→1, working with the founding team to transform static Excel exports into an interactive dashboard.
The Problem
Forecasts were based on outdated, unrelated calculations. The transformation to AI-powered predictions was crucial to catch expensive problems before they occurred.
The Challenge
How do we earn users' trust in AI-driven forecasts while making complex supply chain data simple enough for daily decision-making?
Impact
Served 10+ early customers
Reduced analysis time from days to minutes
Enabled daily decision-making with interactive forecasts
Process
Process
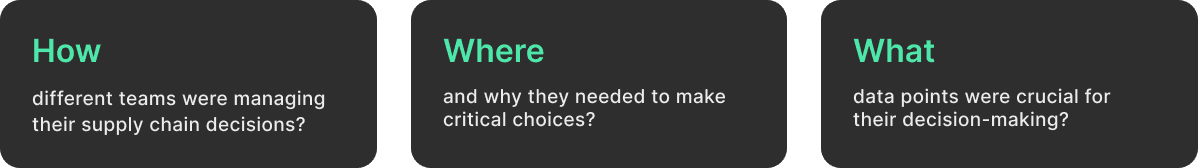
As a solo designer in a fast-moving startup with no research budget, I had to find creative ways to understand users and validate decisions quickly.
As a solo designer in a fast-moving startup with no research budget, I had to find creative ways to understand users and validate decisions quickly.
What I Actually Did
What I Actually Did
Worked closely with founders to understand the problem space
Reviewed existing customer conversations
Analyzed customer files to understand their workflows
Conducted quick 15-minute validation calls with users
Worked closely with founders to understand the problem space
Reviewed existing customer conversations
Analyzed customer files to understand their workflows
Conducted quick 15-minute validation calls with users
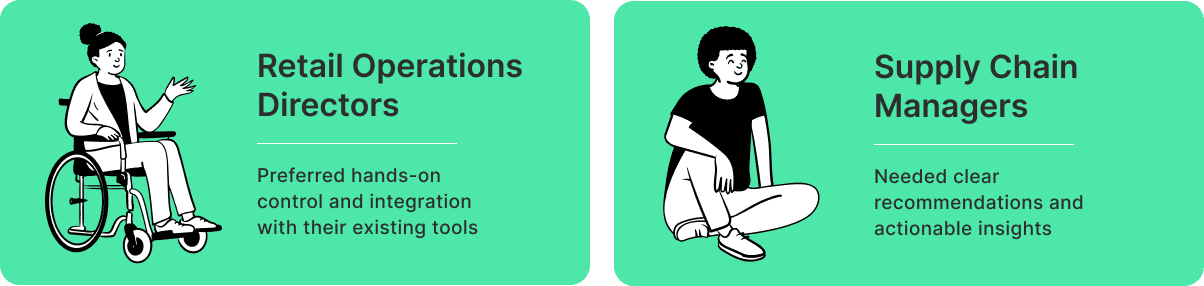
The product mainly addressed two types of users, whose characterization was easy for me to work with in order to think about them in an agile way throughout development.
The product mainly addressed two types of users, whose characterization was easy for me to work with in order to think about them in an agile way throughout development.
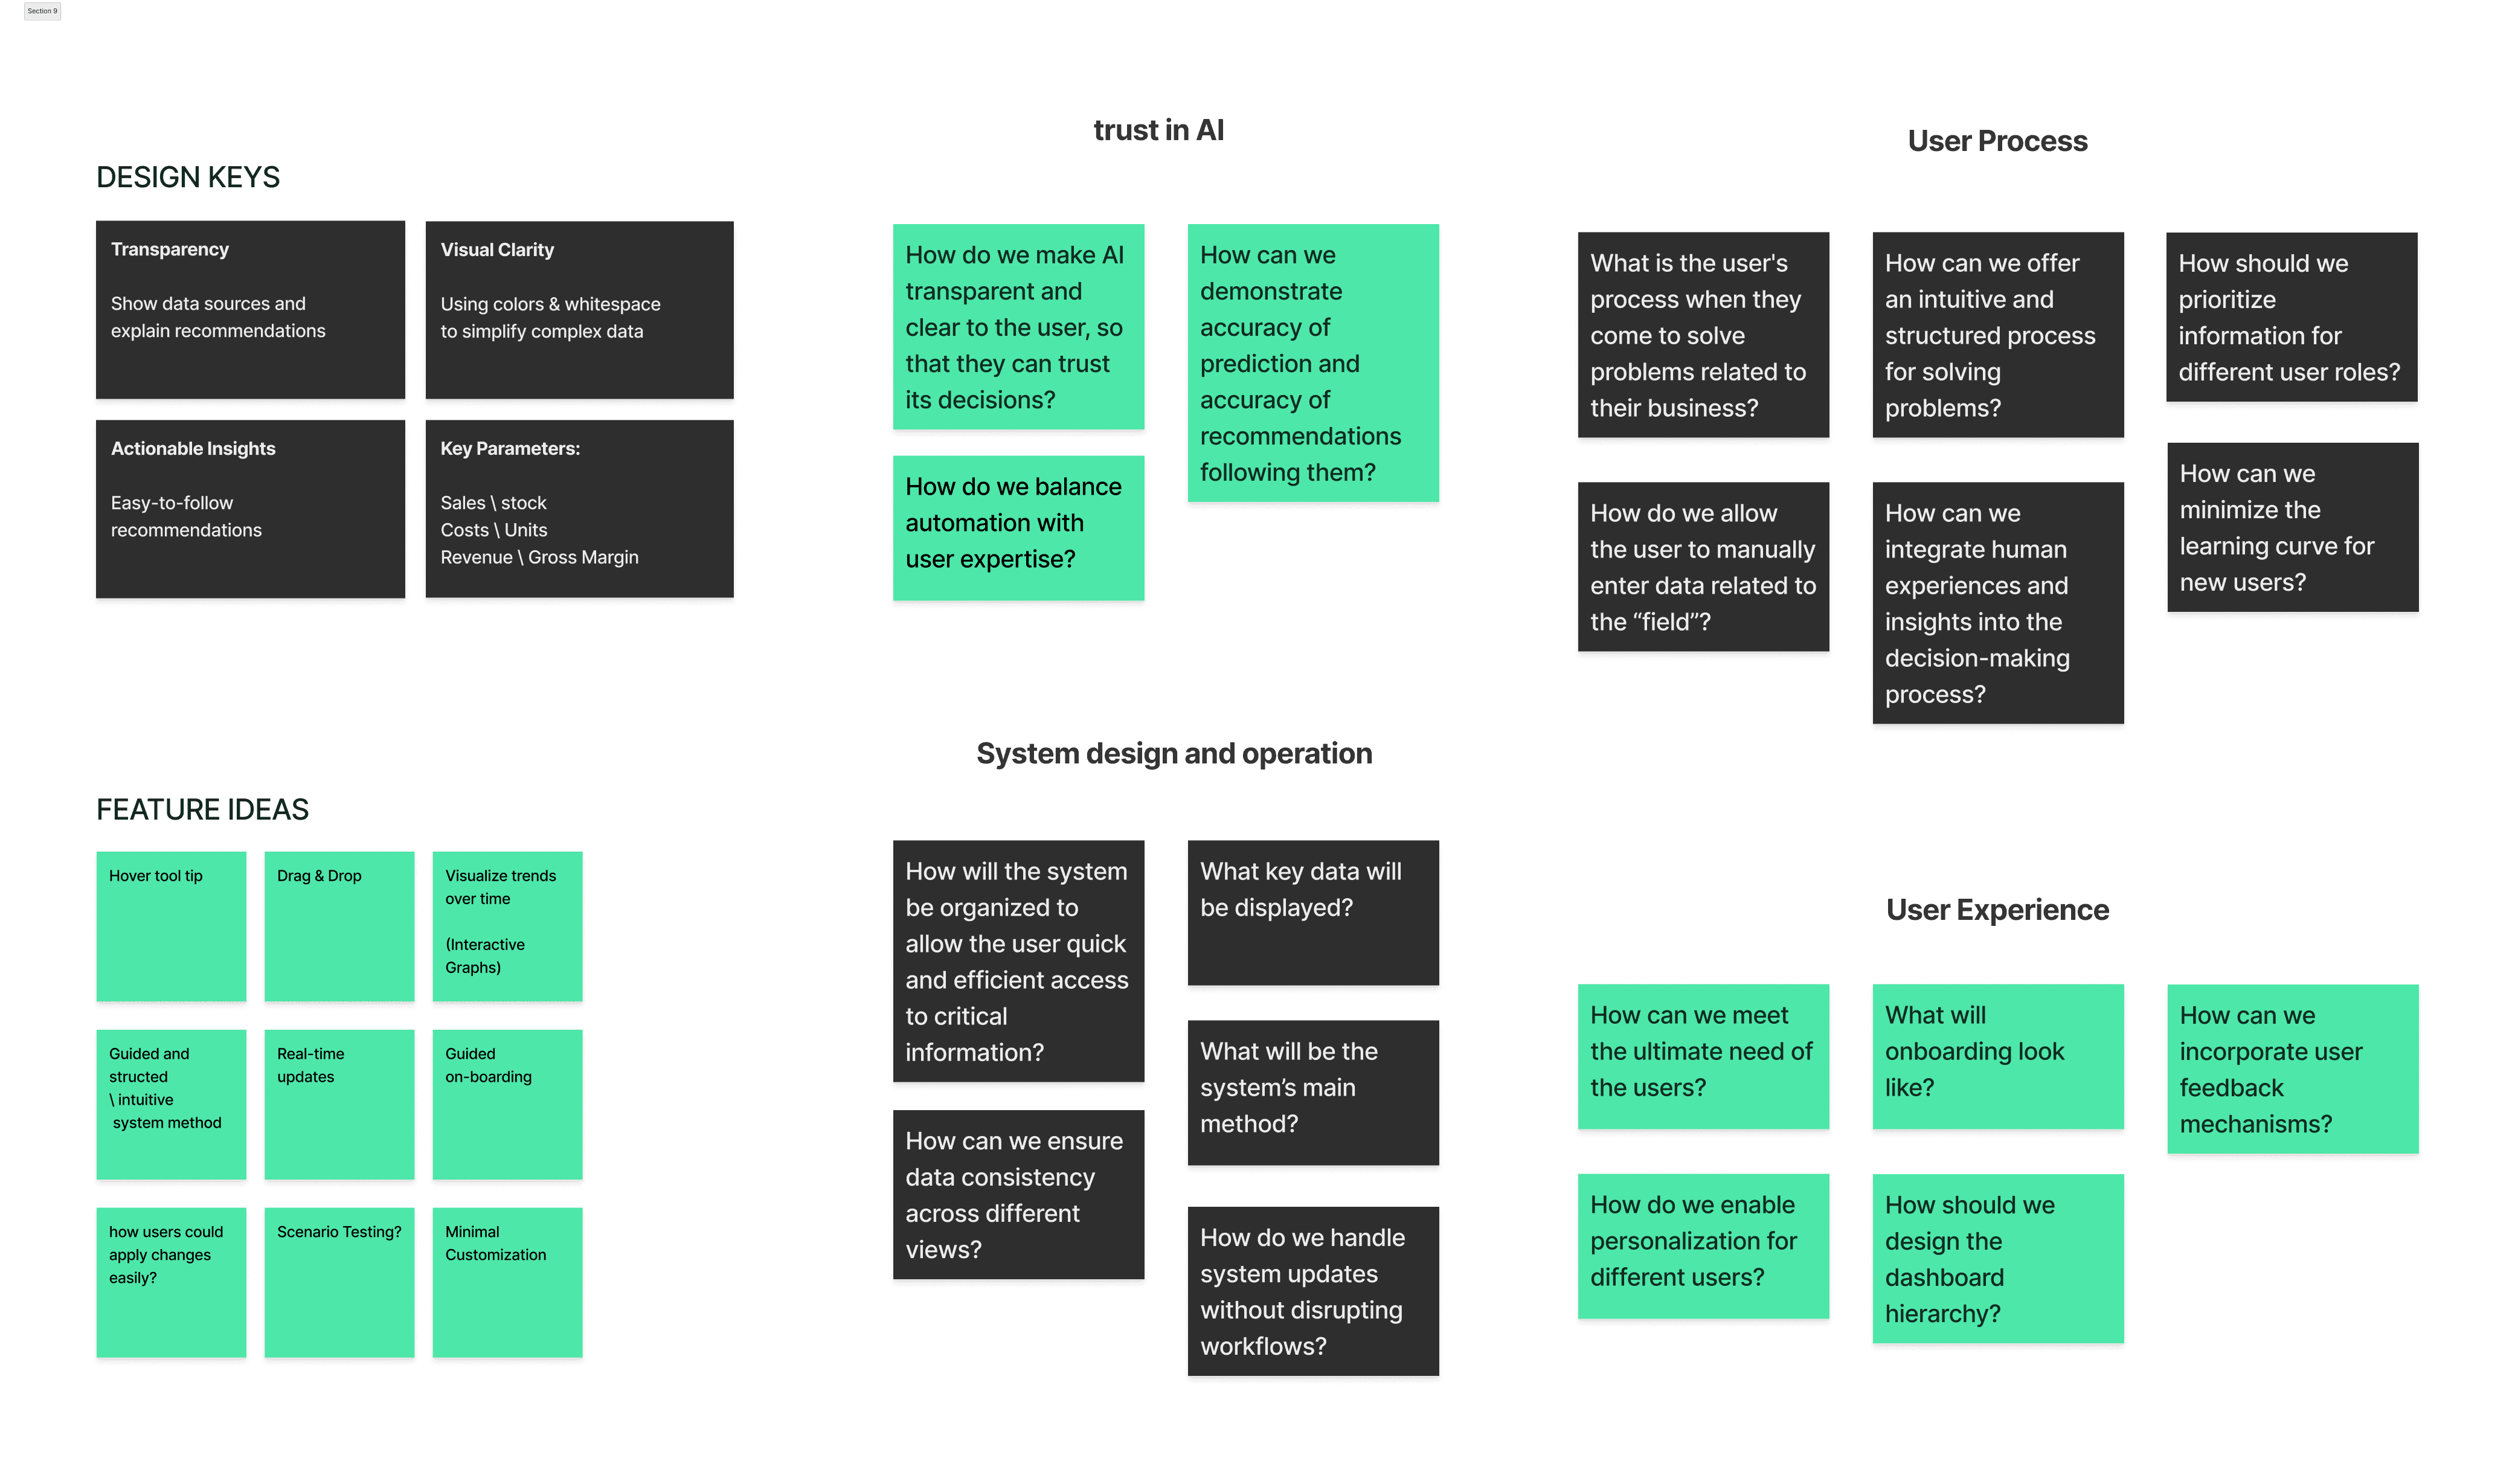
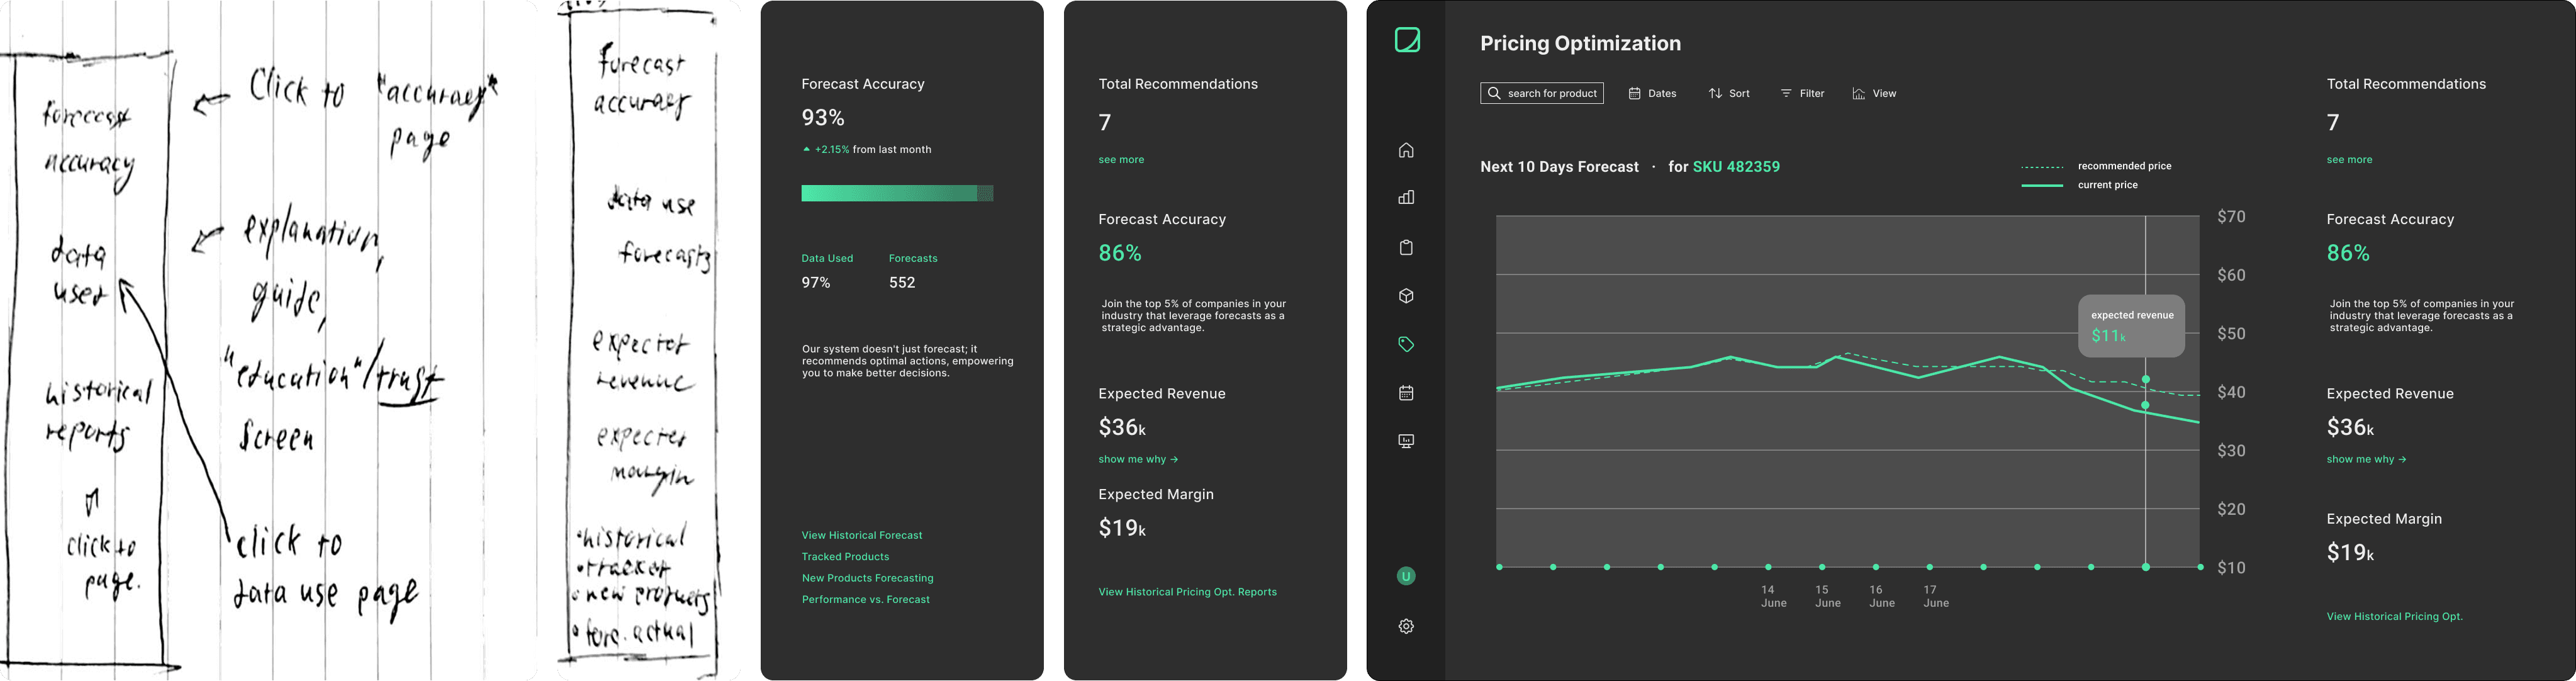
Wireframing
The wireframing process evaluated various approaches to information hierarchy and real-time performance visualization. Strategic decisions focused on ensuring workflow continuity, enhancing system transparency, and establishing data-driven indicators that empower informed decision-making.
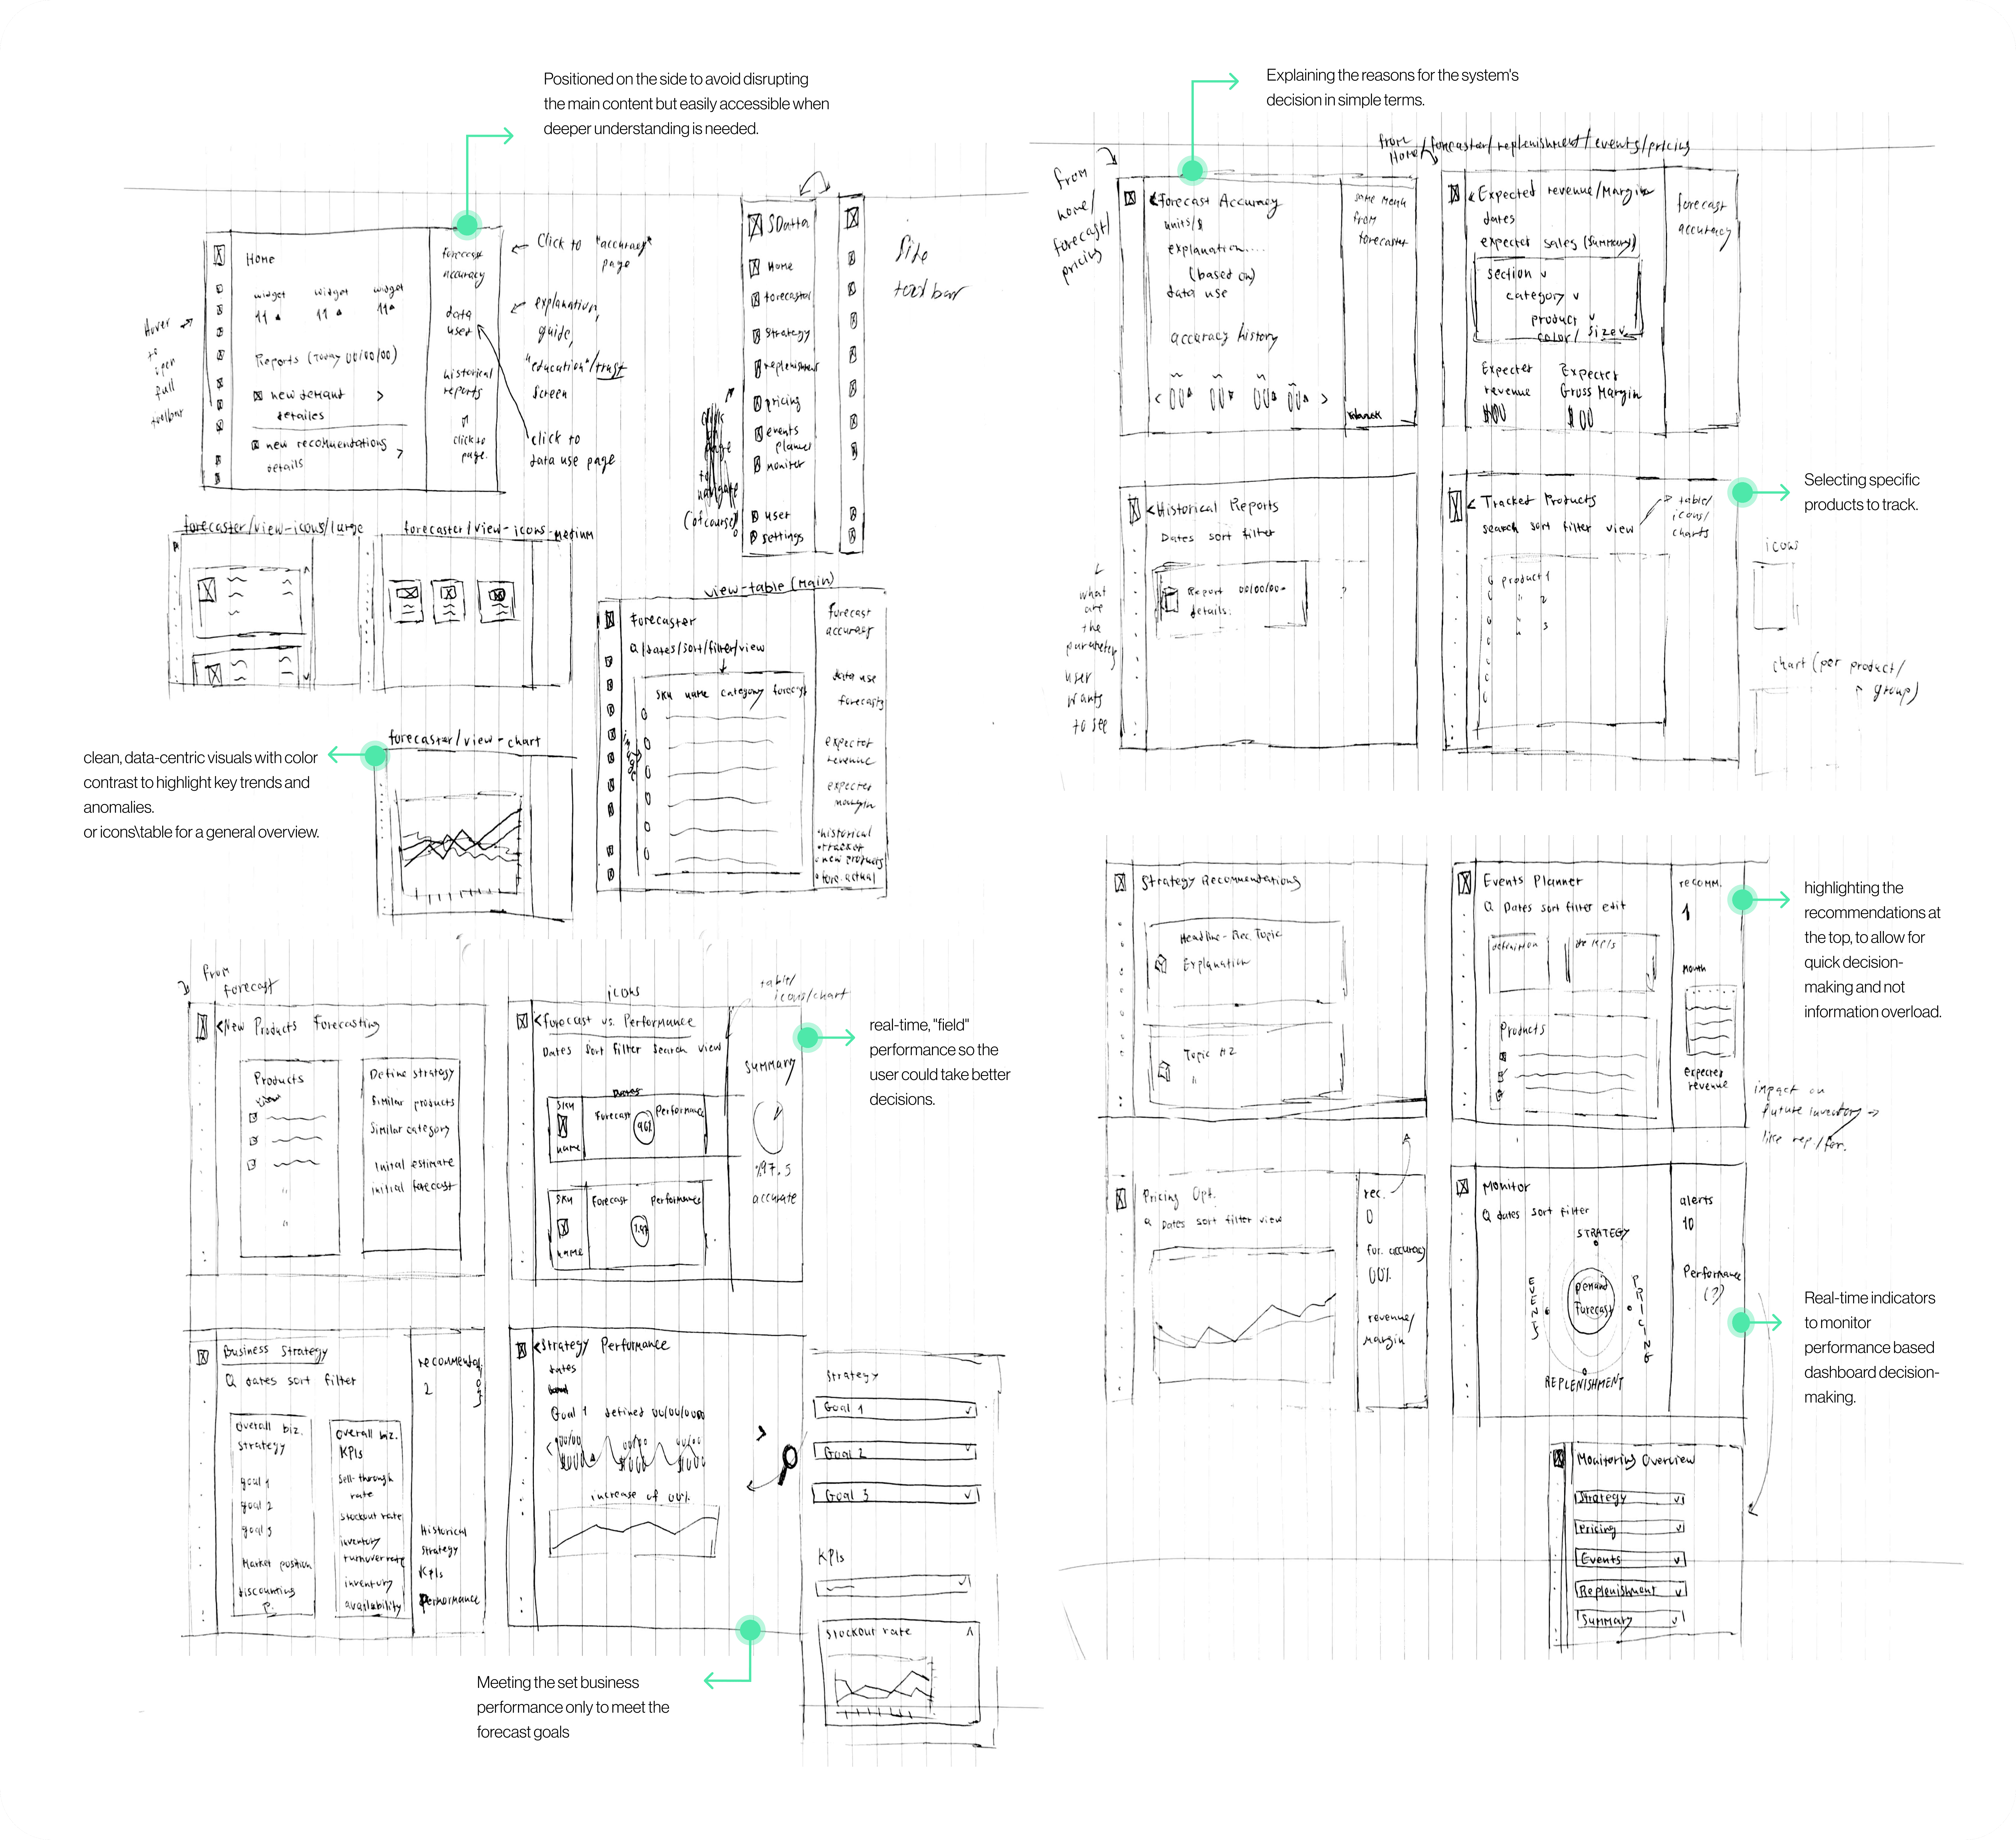
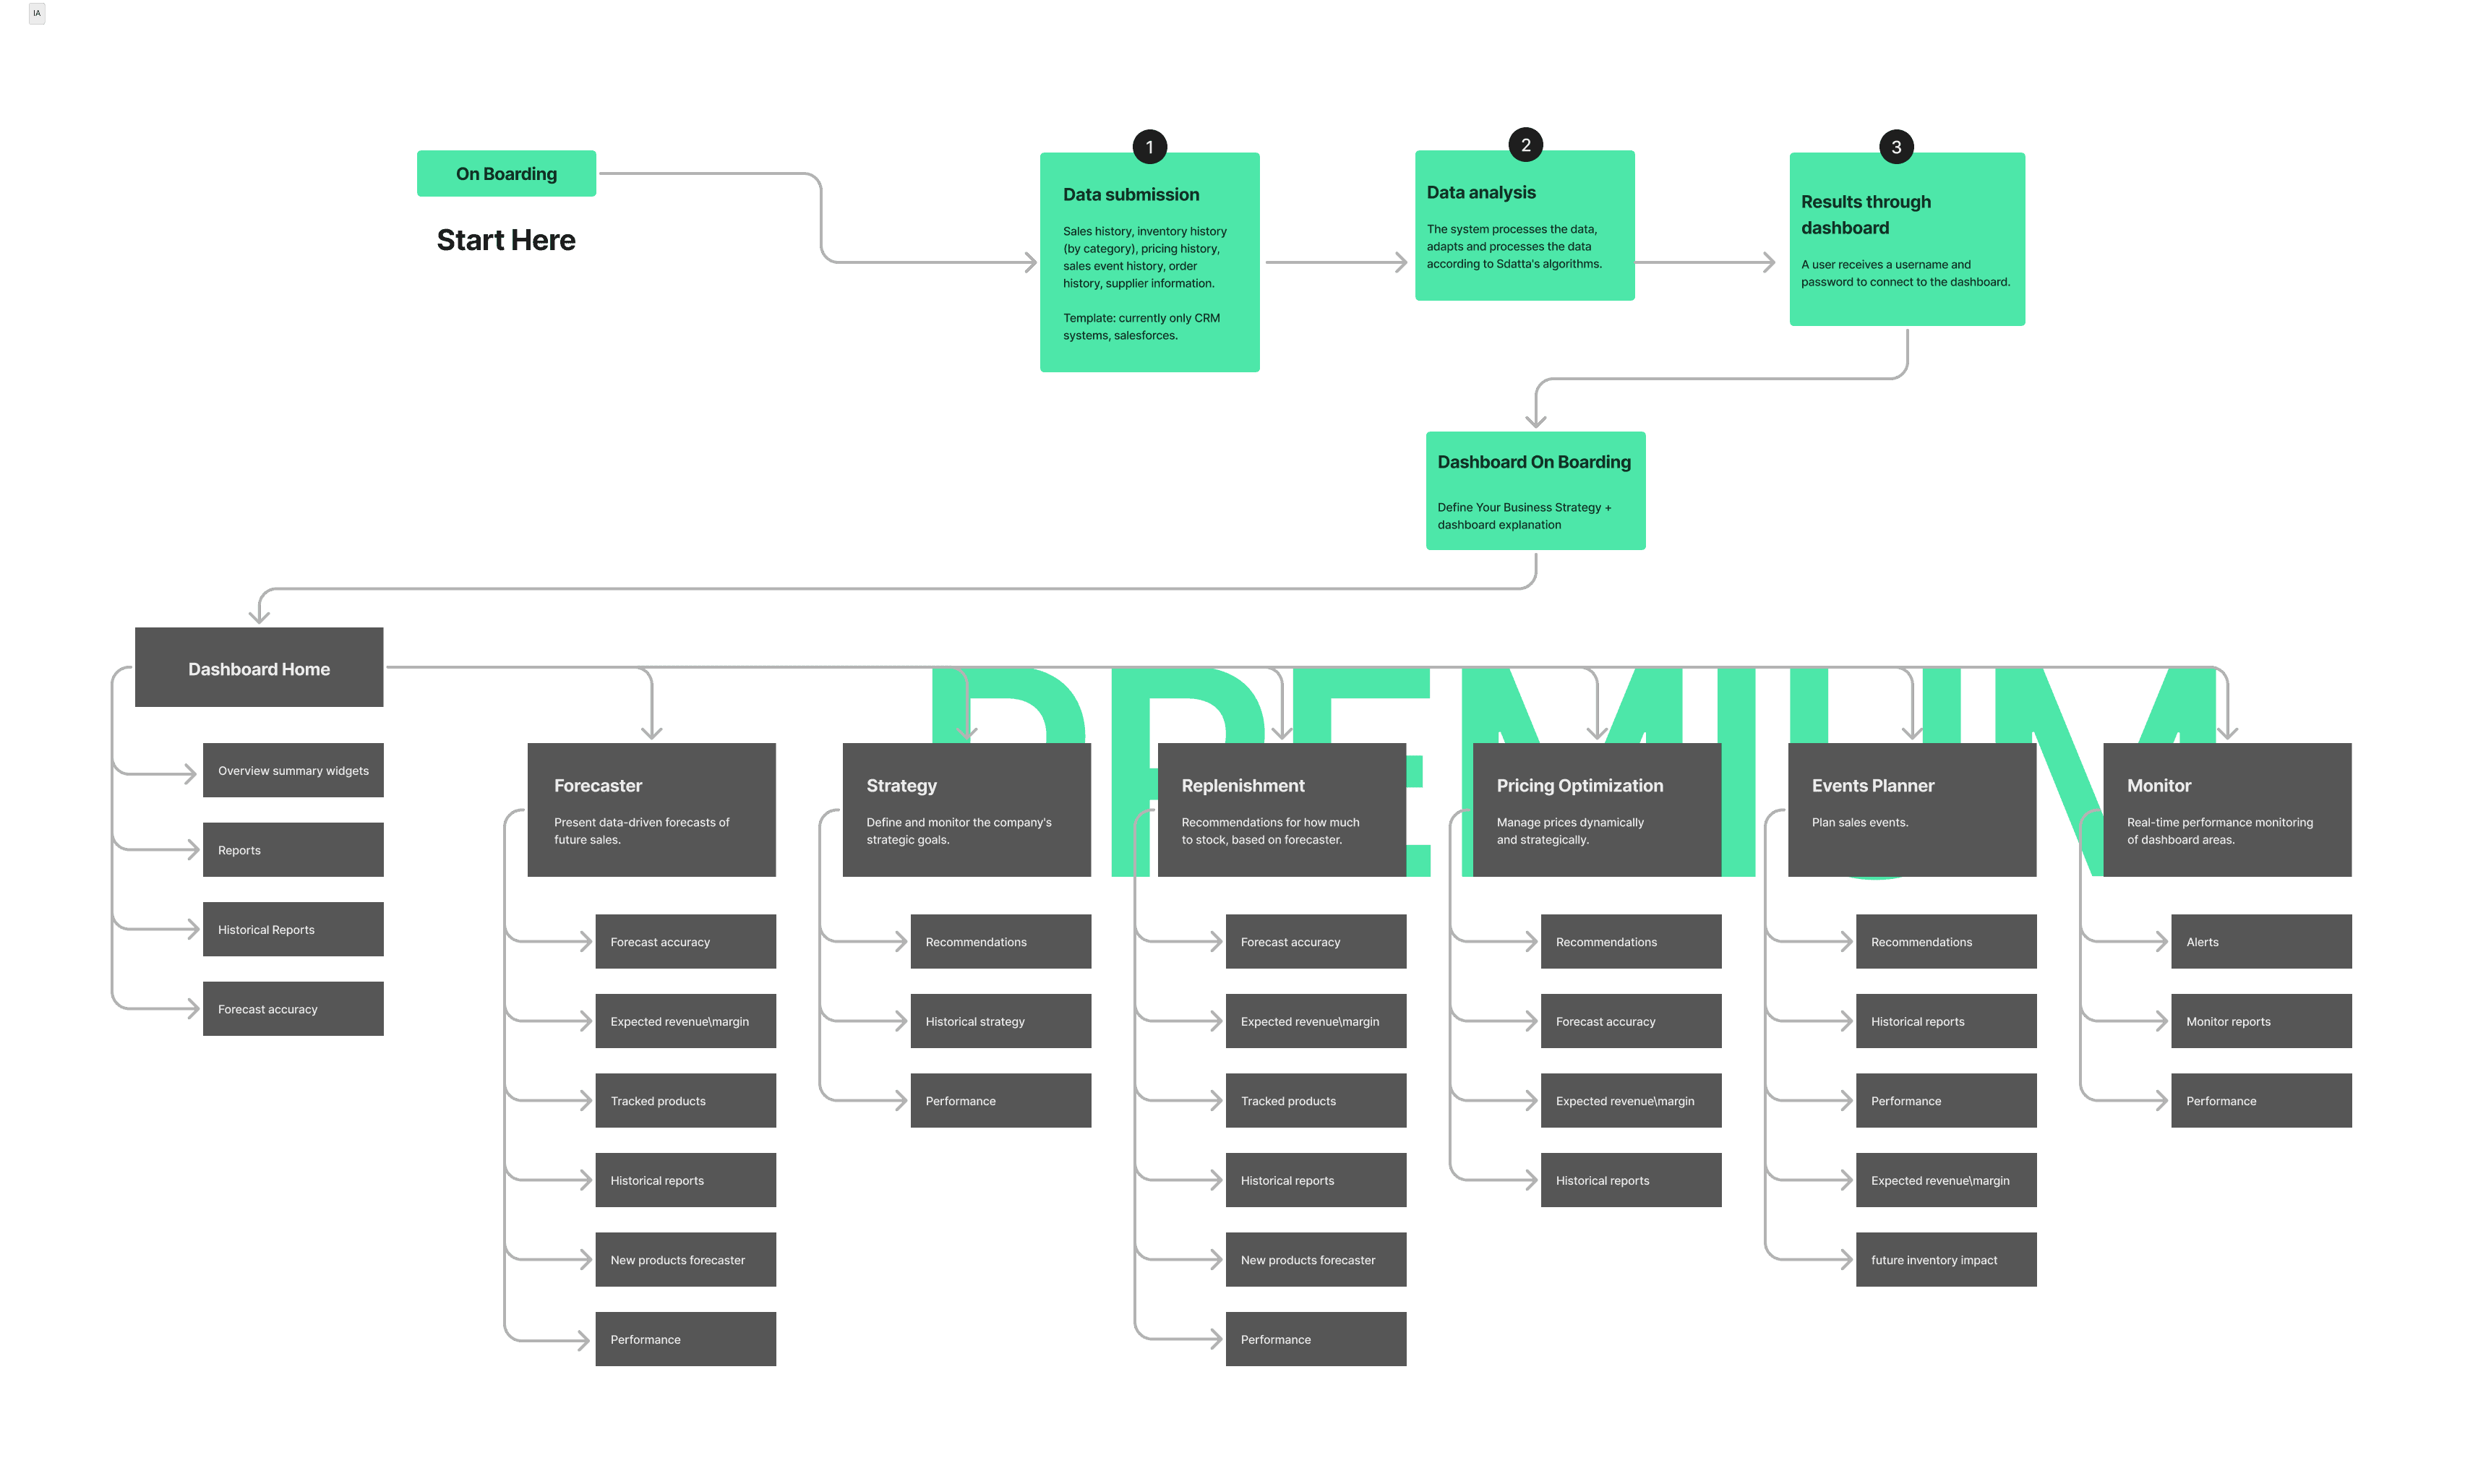
Information Architecture
Information Architecture
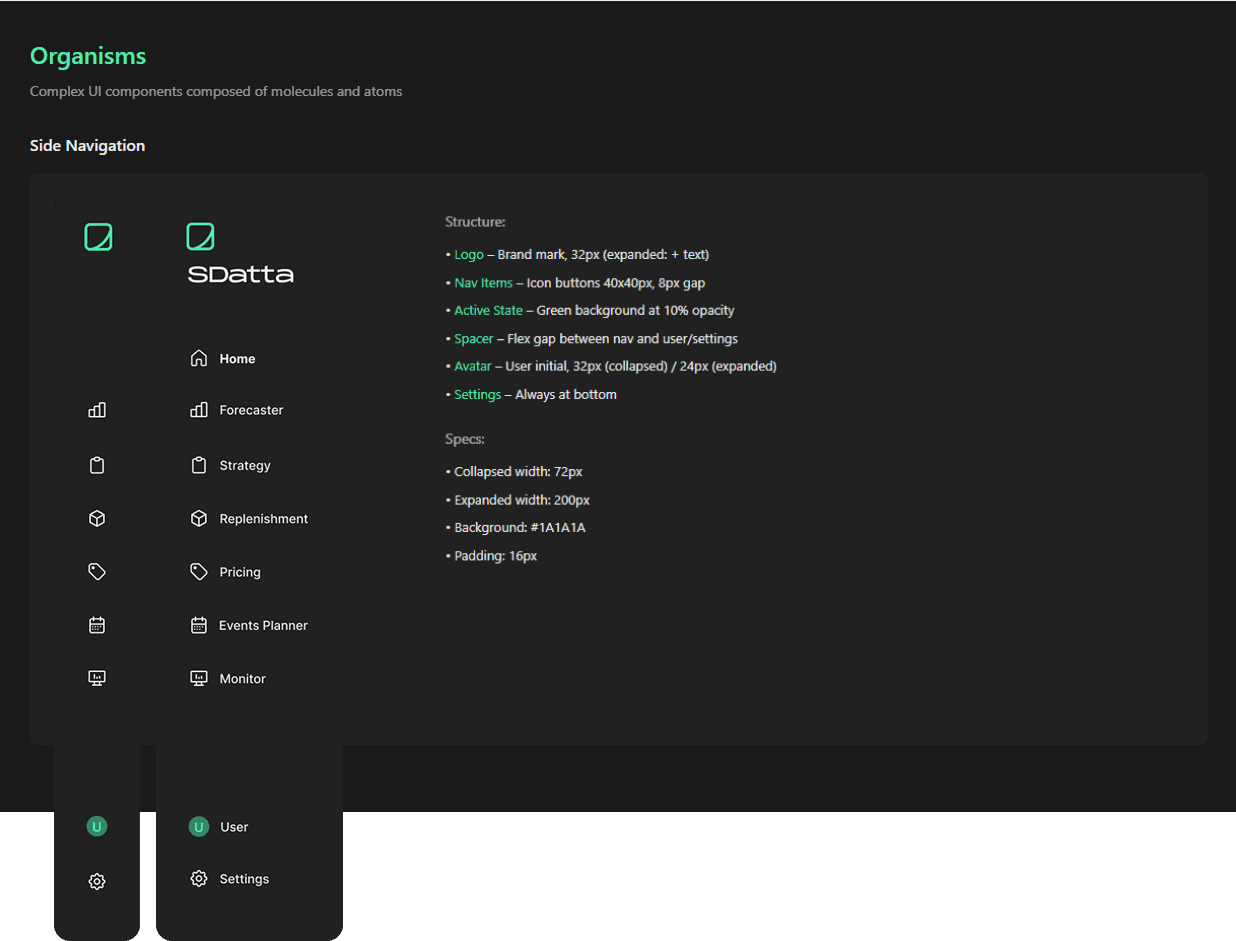
The project involved mapping the complete user journey and dashboard ecosystem. The information architecture illustrates the flow from onboarding through data submission and analysis, providing access to six specialized modules: Forecaster, Strategy, Replenishment, Pricing Optimization, Events Planner, and Monitor. This creates a scalable system designed to grow alongside business needs.
The project involved mapping the complete user journey and dashboard ecosystem. The information architecture illustrates the flow from onboarding through data submission and analysis, providing access to six specialized modules: Forecaster, Strategy, Replenishment, Pricing Optimization, Events Planner, and Monitor. This creates a scalable system designed to grow alongside business needs.

Solutions
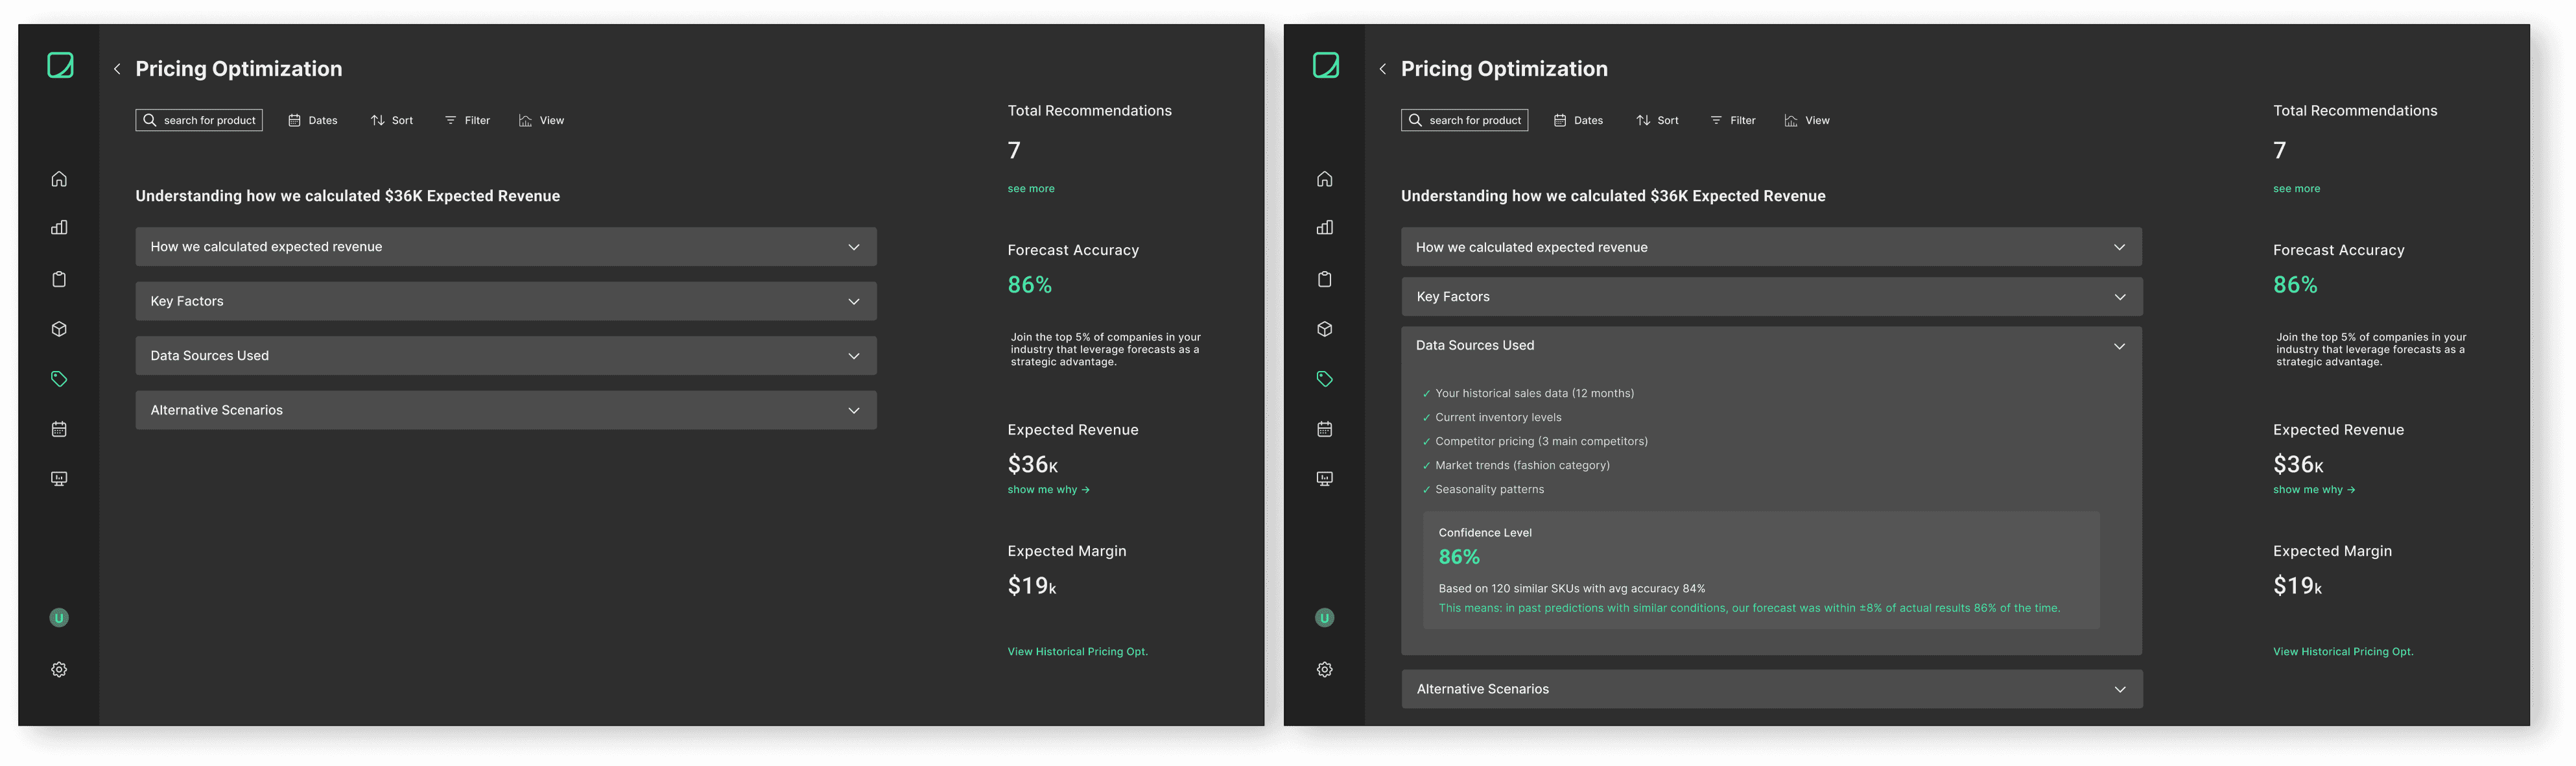
AI transparacy
Problem
Users rejected AI forecasts they couldn't validate
Problem
Users rejected AI forecasts they couldn't validate
My approach
Designed progressive disclosure: summary → drill-down into data sources, confidence levels, calculation logic
"Show me why" on any prediction
Color-coded confidence for quick scanning
My approach
Designed progressive disclosure: summary → drill-down into data sources, confidence levels, calculation logic
"Show me why" on any prediction
Color-coded confidence for quick scanning
Result
Users validated AI against domain expertise → trust in recommendations
Result
Users validated AI against domain expertise → trust in recommendations
Strategy Configuration
Making AI Recommendations Useful
Making AI
Recommendations Useful
Problem
AI suggestions were technically accurate but useless if they ignored business constraints, budget limits, and strategic priorities. Teams couldn't act on generic recommendations.
Problem
AI suggestions were technically accurate but useless if they ignored business constraints, budget limits, and strategic priorities. Teams couldn't act on generic recommendations.
My Solution
Strategy configuration layer that adapts AI outputs to business reality:
5-minute wizard to define objectives, constraints, and priorities
AI recommendations automatically filtered through user strategy
My Solution
Strategy configuration layer that adapts AI outputs to business reality:
5-minute wizard to define objectives, constraints, and priorities
AI recommendations automatically filtered through user strategy
Monitoring Layer
Predictions Meet Reality
Predictions Meet Reality
Problem
The algorithm forecasted and recommended, but couldn't see what actually happened. Users missed critical signals when reality diverged from predictions.
Problem
The algorithm forecasted and recommended, but couldn't see what actually happened. Users missed critical signals when reality diverged from predictions.
Problem
The algorithm forecasted and recommended, but couldn't see what actually happened. Users missed critical signals when reality diverged from predictions.
Key Research Insight
Neither algorithm nor user has the full picture alone. The monitoring layer bridges both—algorithm can't see reality, users can't process thousands of SKUs.
Key Research Insight
Neither algorithm nor user has the full picture alone. The monitoring layer bridges both—algorithm can't see reality, users can't process thousands of SKUs.
My Solution
Monitoring layer that connects algorithm to ground truth
Alerts when predictions vs. reality diverge significantly
Tracks recommendation performance
Flags strategy conflicts with real-world data
My Solution
Monitoring layer that connects algorithm to ground truth
Alerts when predictions vs. reality diverge significantly
Tracks recommendation performance
Flags strategy conflicts with real-world data
Impact
Teams validated AI in real-time and caught when assumptions broke. The system learned from reality, not just history.
Impact
Teams validated AI in real-time and caught when assumptions broke. The system learned from reality, not just history.
Impact
Teams validated AI in real-time and caught when assumptions broke. The system learned from reality, not just history.
Unified Filtering
Unified Filtering System
Unified Filtering System
Problem
Analyzing thousands of SKUs across dimensions = Excel chaos
Problem
Analyzing thousands of SKUs across dimensions = Excel chaos
My design
Hierarchical filters enabling multi-dimensional analysis (time / product / location / performance)
Multi-select combinations with visual chips and saved presets
Real-time result count showing impact of each filter
My design
Hierarchical filters enabling multi-dimensional analysis (time / product / location / performance)
Multi-select combinations with visual chips and saved presets
Real-time result count showing impact of each filter
Result
Enabled multi-dimensional analysis that was impossible in Excel
Result
Enabled multi-dimensional analysis that was impossible in Excel

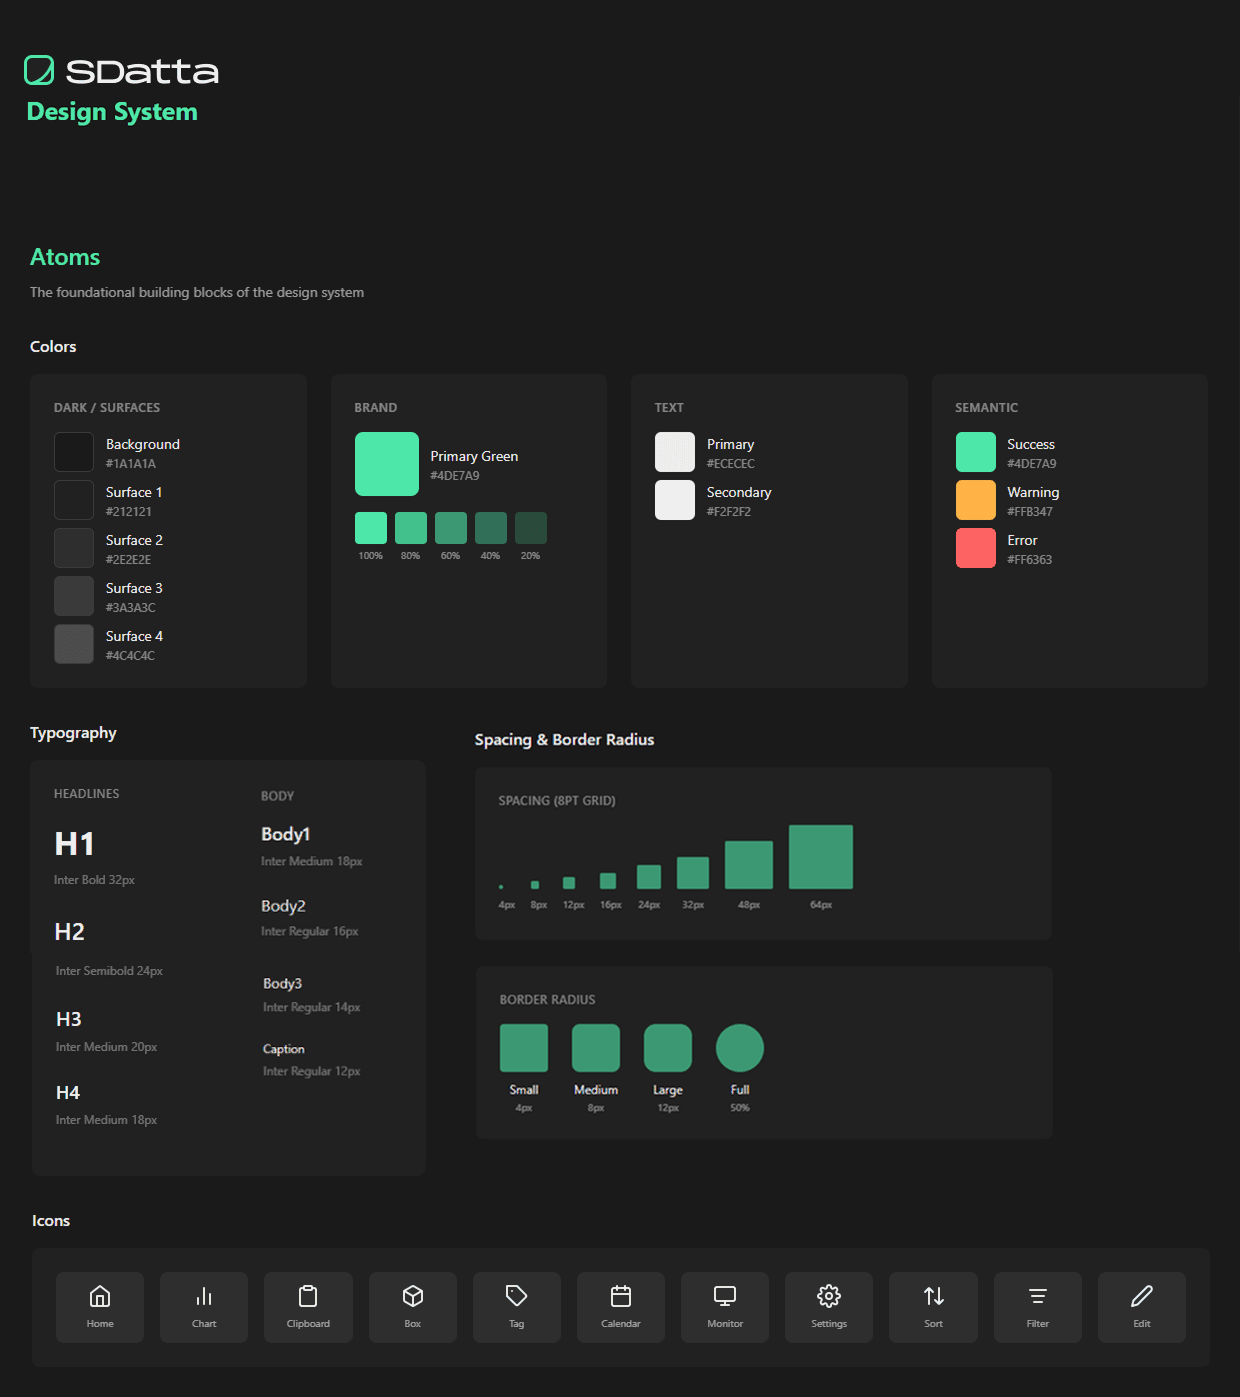
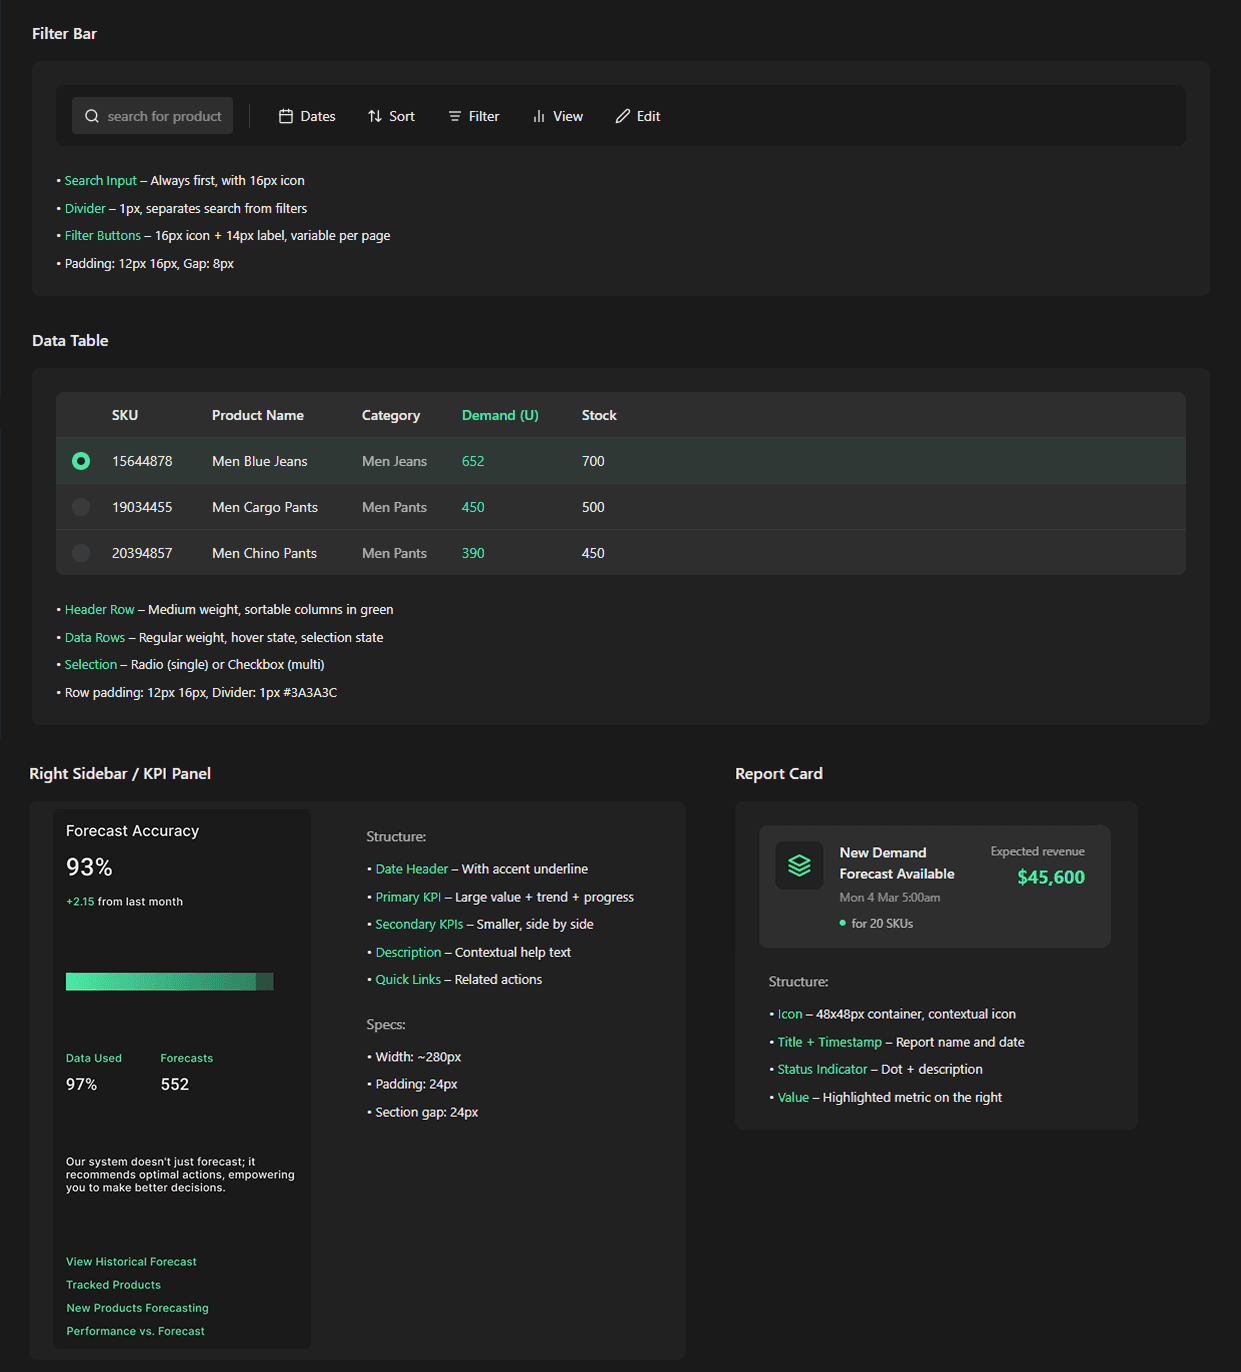
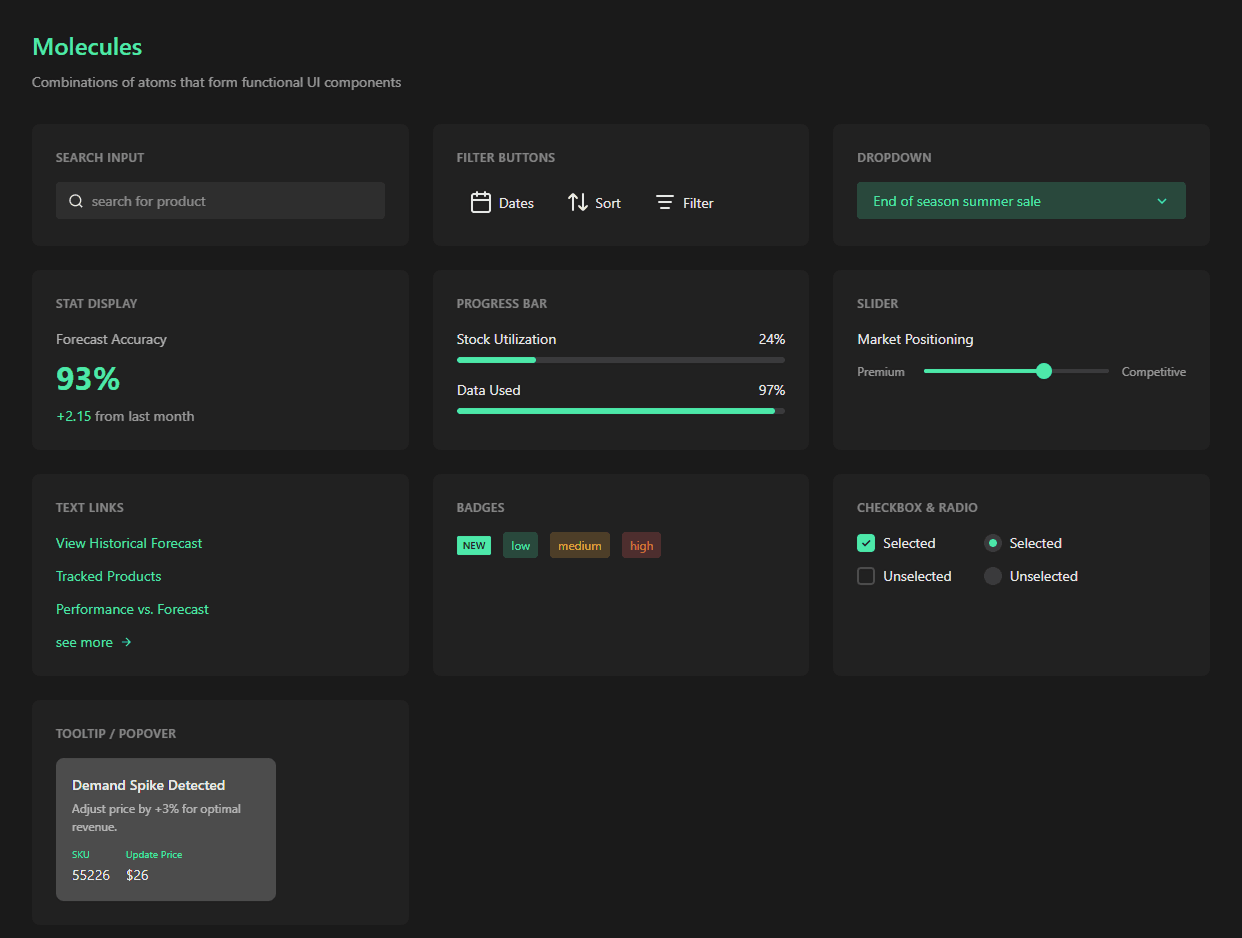
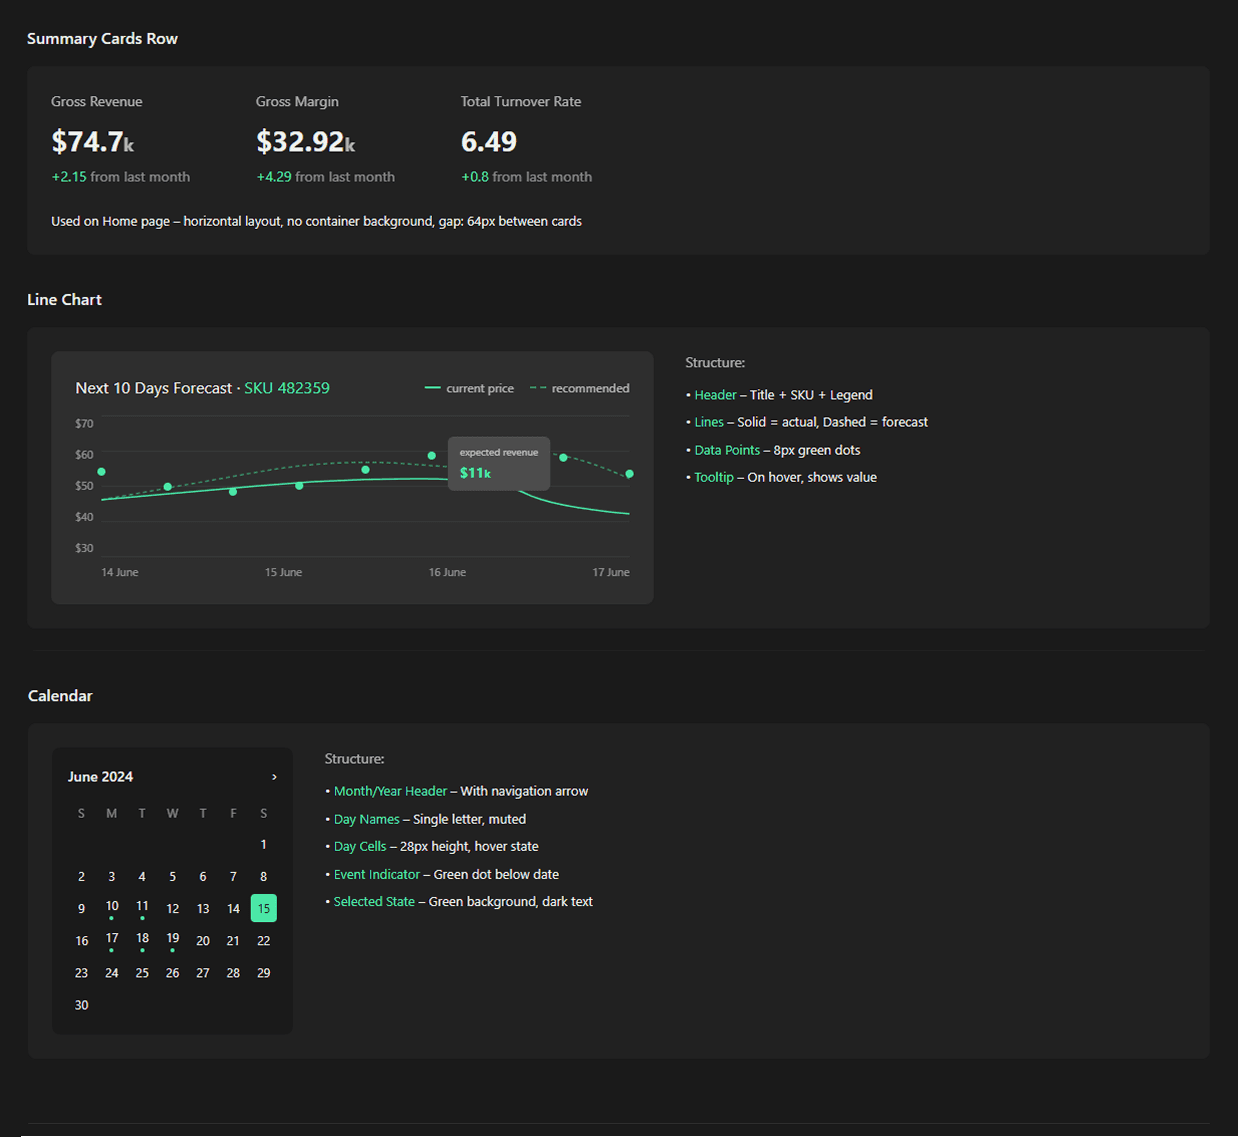
Design System
Design System
As a solo designer working directly with developers, I needed a system that would maintain consistency across all screens without constant oversight.
I applied Atomic Design methodology—building from foundational atoms (colors, typography, icons), through functional molecules (inputs, stat displays, buttons), to complete organisms (navigation, tables, KPI panels).
The result
A shared language between design and development. New features could be assembled from documented components, the UI stayed consistent, and the system scaled to support 3 post-launch features.
Impact
Teams validated AI in real-time and caught when assumptions broke. The system learned from reality, not just history.
The result
A shared language between design and development. New features could be assembled from documented components, the UI stayed consistent, and the system scaled to support 3 post-launch features.
As a solo designer working directly with developers, I needed a system that would maintain consistency across all screens without constant oversight.
I applied Atomic Design methodology—building from foundational atoms (colors, typography, icons), through functional molecules (inputs, stat displays, buttons), to complete organisms (navigation, tables, KPI panels).
Impact
Teams validated AI in real-time and caught when assumptions broke. The system learned from reality, not just history.
Post Launch
Tiered Product
Architecture
We released the product to 10 customers. But most of what I learned happened after launch. Let me tell you about 3 things:
Impact
Teams validated AI in real-time and caught when assumptions broke. The system learned from reality, not just history.
We released the product to 10 customers. But most of what I learned happened after launch. Let me tell you about 3 things:
Customers said in sales: 'We just need forecasts. We don't need recommendations. Our analysts will do that.' So we released the product to them with everything — forecasts + recommendations.
What I discovered in the data
They used recommendations more than we expected. They came in, they saw, they tried — they trusted them.
What I did
I suggested splitting the product into 3 tiers:
Basic — just forecasts, no recommendations
Pro — forecasts + recommendations
Enterprise — everything + full simulation plan (that’s the next project).
The result
Customers paid more for Pro. Product-market fit improved — customers could start where they were comfortable, and upgrade when they were ready.
As a solo designer working directly with developers, I needed a system that would maintain consistency across all screens without constant oversight.
I applied Atomic Design methodology—building from foundational atoms (colors, typography, icons), through functional molecules (inputs, stat displays, buttons), to complete organisms (navigation, tables, KPI panels).
Impact
Teams validated AI in real-time and caught when assumptions broke. The system learned from reality, not just history.

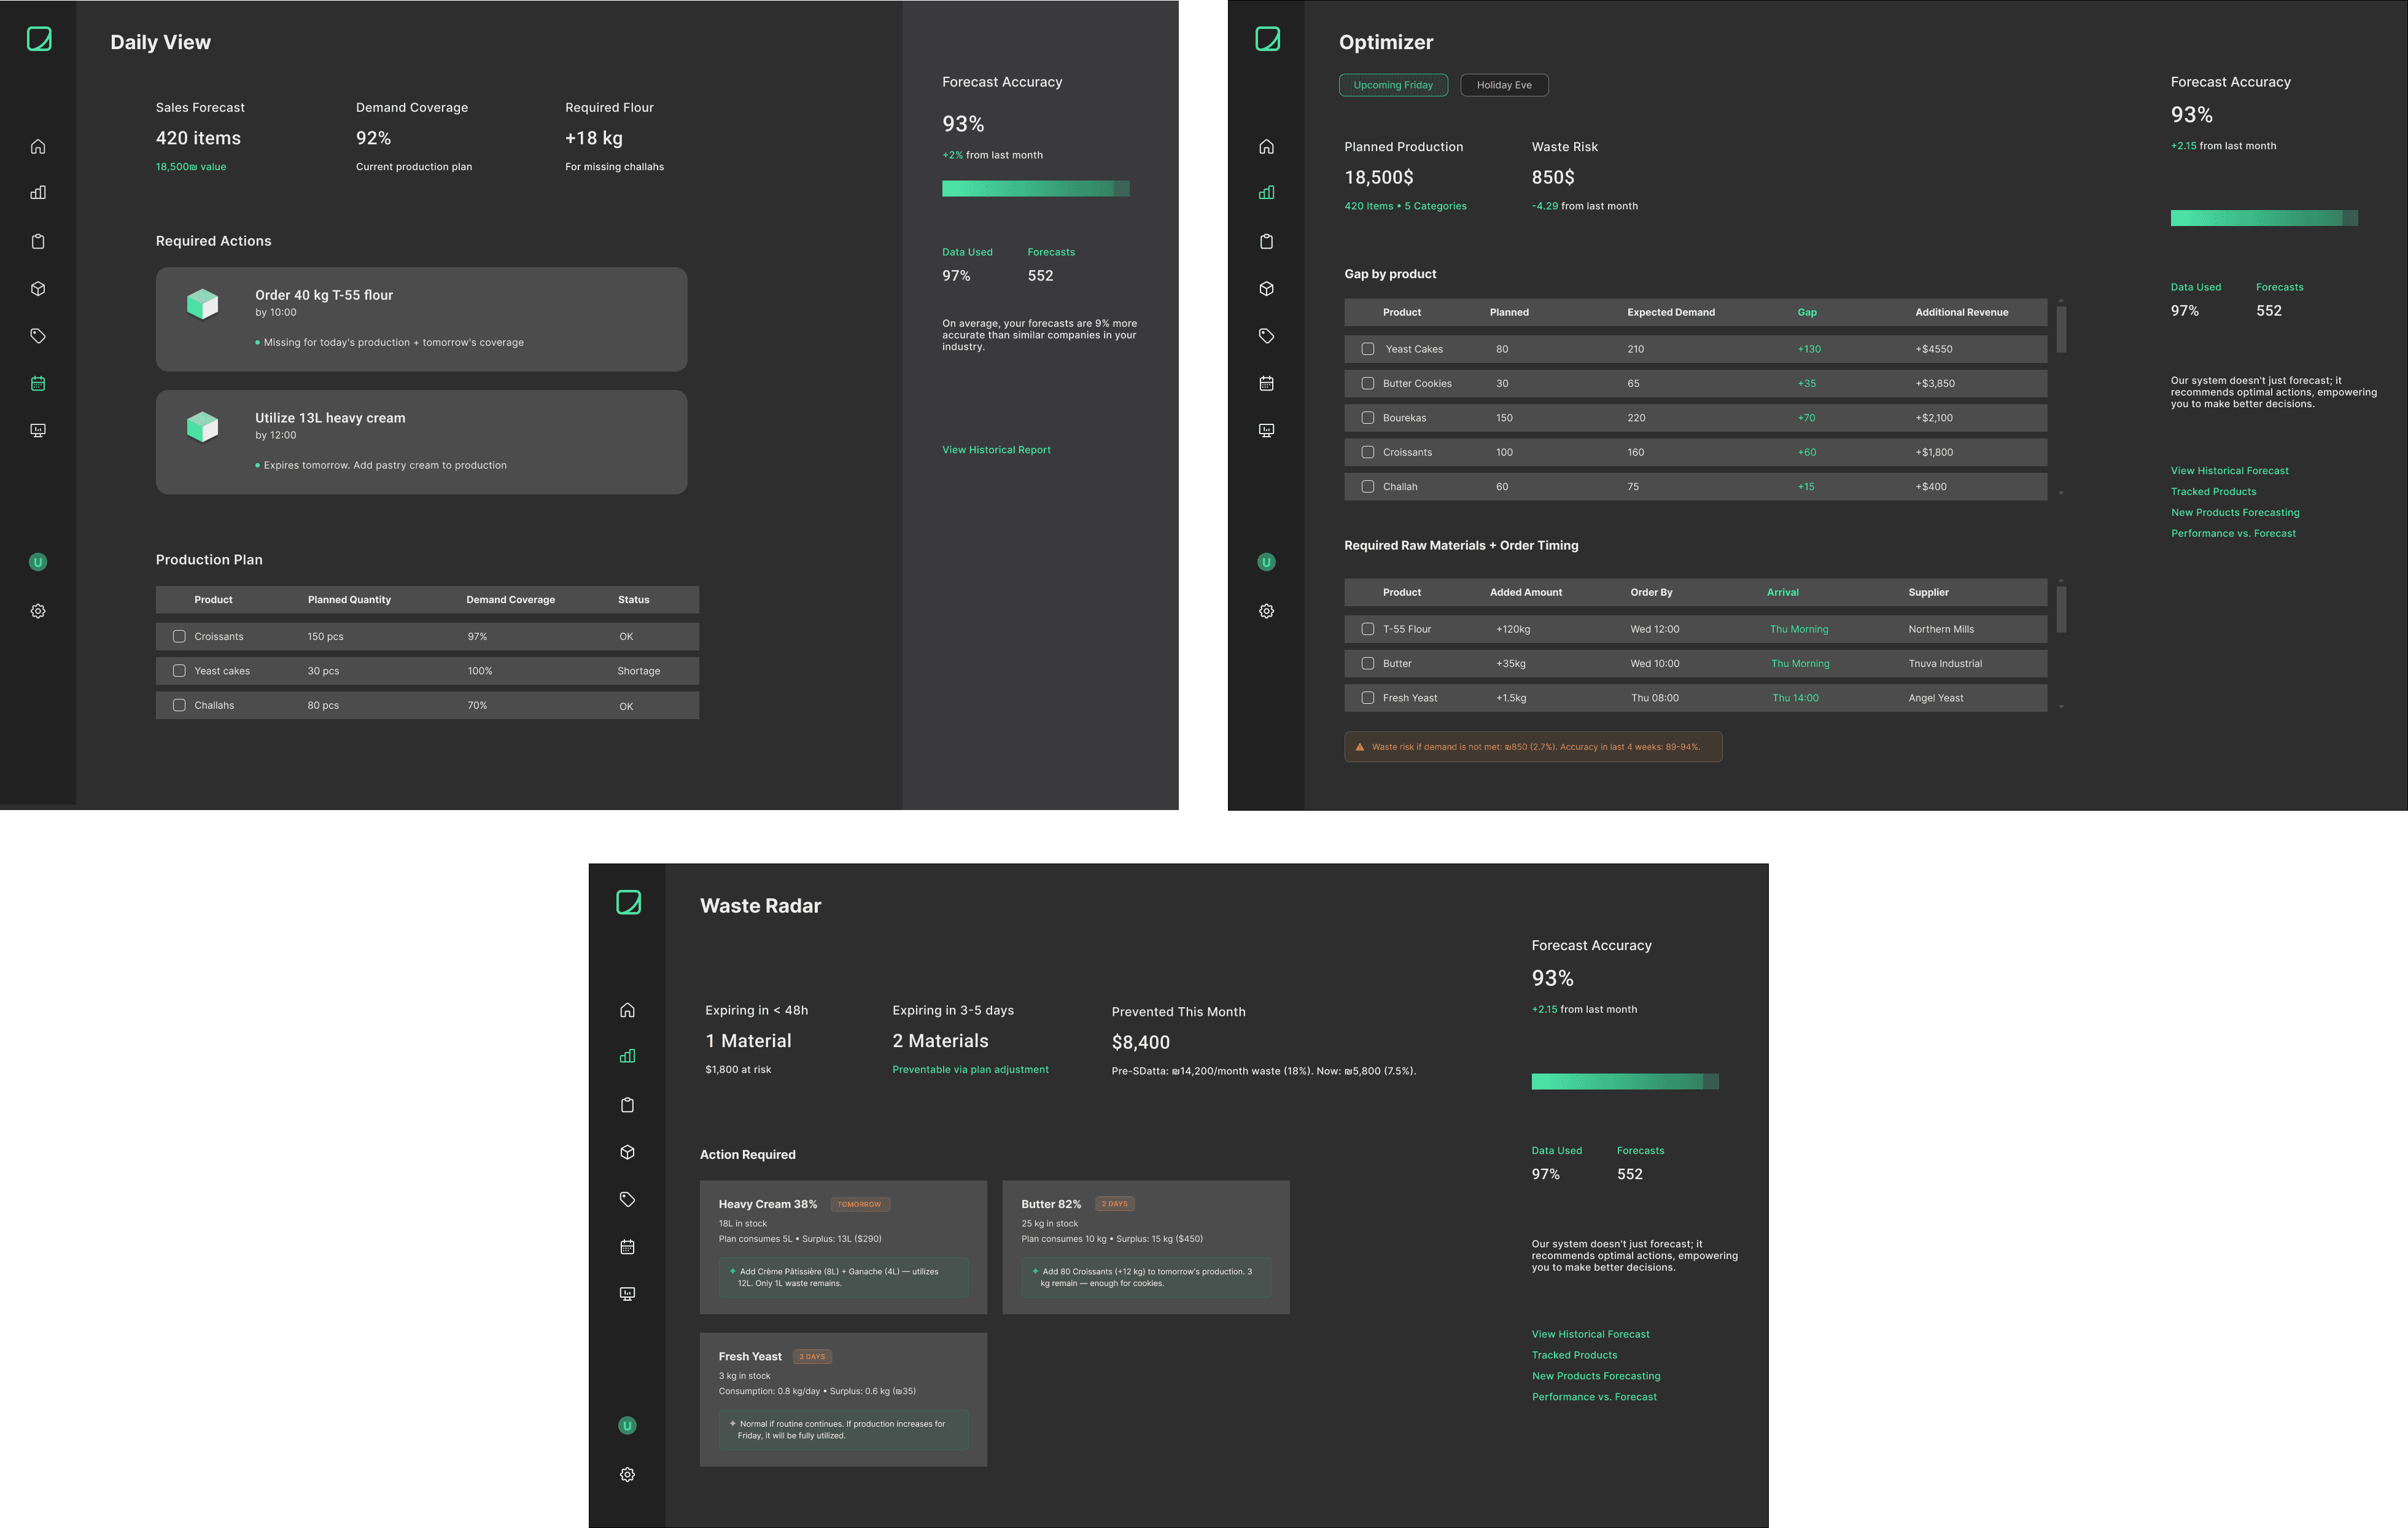
Domain Adaptation
Fashion → Food Production
Following the successful launch in the fashion sector, we explored adapting the AI system to a new vertical: Food Production (e.g., bakery chains).
Impact
Teams validated AI in real-time and caught when assumptions broke. The system learned from reality, not just history.
Following the successful launch in the fashion sector, we explored adapting the AI system to a new vertical: Food Production (e.g., bakery chains).
While the core AI forecasting algorithm remained accurate, the user needs were fundamentally different. Fashion deals with seasonal trends spanning months; food deals with 48-hour shelf life, immediate waste, and daily production constraints.
The Challenge
How do you translate a macro-level, seasonal strategy tool into a micro-level, daily operational dashboard without rebuilding the entire system?
What I did
Design for scale through modularity. Instead of designing a separate, isolated product, my approach was to keep the system entirely agile. The goal was to build a scalable, flexible framework. The vision was to create a dashboard that could eventually support multiple stages of maturity across various fast-paced industries.
The result
By keeping agility and scale top of mind, I demonstrated that the dashboard could seamlessly pivot across different supply chains. This exploration laid the groundwork for a multi-stage, cross-industry product roadmap, proving our core components could adapt to the specific pace of any industry.
As a solo designer working directly with developers, I needed a system that would maintain consistency across all screens without constant oversight.
I applied Atomic Design methodology—building from foundational atoms (colors, typography, icons), through functional molecules (inputs, stat displays, buttons), to complete organisms (navigation, tables, KPI panels).
Impact
Teams validated AI in real-time and caught when assumptions broke. The system learned from reality, not just history.
Impact
& Outcomes
Impact & Outcomes
Impact & Outcomes
Delivered
0→1 product in 5 months, 10 launch customers, contributed to seed funding
Business Results
Daily engagement - Teams shifted from weekly planning cycles to real-time dashboard monitoring
Decision velocity - Reduced analysis time from ~3-5 days (typical industry standard) to under 30 minutes
Product evolution - Design system scaled to support 3 post-launch features
Organic growth - Early adopters became active advocates, referring new customers
What I Owned
& Learned
What I Owned & Learned
What I Owned & Learned

End-to-end product design
Strategy, UX/UI, and delivery for the company's first product—launched to 10 early customers in 5 months.
AI adoption is a design problem, not a data problem
The algorithm was accurate, but users didn't trust it. Building confidence required showing how it thinks, not just what it predicts.
Working backwards from constraints
Limited dev resources meant ruthless prioritization. Single-store focus over multi-network. Core features over nice-to-haves. Shipped fast, learned faster.
