Helm
Catching fleet conflicts before the engine starts
Catching fleet conflicts before the engine starts
From fleet visibility to the next right action
From fleet visibility to the next right action

My Role
My Role
My Role
Design Lead
Design Lead
Design Lead
Timeline
Timeline
Timeline
Q4 2023-Q3 2024
Q4 2023-Q3 2024
Q4 2023-Q3 2024
Team
Team
Team
1 Designer, 3 Data Scientist , 2 DevOps, CTO, CEO
1 Designer, 3 Data Scientist , 2 DevOps, CTO, CEO
1 Designer, 3 Data Scientist , 2 DevOps, CTO, CEO
Overview
Overview
The best fleet platforms are good at showing you your fleet. GPS position, maintenance status, driver hours. The data is there. But each module speaks only for itself. Insurance doesn't know about the trip scheduled two days after the policy expires. Maintenance doesn't know a vehicle is due for a 340 km run next tuesday, and needs servicing.
The manager is the one managing manually, across tabs, every single day.
That's exactly what Helm is trying to solve. There's a conflict-detection engine underneath it that pulls together trips, insurance, maintenance, and driver data — and whatever needs attention today shows up on the first screen. Because at the end of the day, the platform that saves fleets the most money and headaches isn't the one with the most data — it's the one that tells you what to do with it.
My Role
Led product strategy and designed the UI/UX for the company's first product from
0→1, working with the founding team to transform static Excel exports into an interactive dashboard.
The Problem
Forecasts were based on outdated, unrelated calculations. The transformation to AI-powered predictions was crucial to catch expensive problems before they occurred.
The Challenge
How do we earn users' trust in AI-driven forecasts while making complex supply chain data simple enough for daily decision-making?
Impact
Served 10+ early customers
Reduced analysis time from days to minutes
Enabled daily decision-making with interactive forecasts
Understanding the Space
Understanding the Space
Before touching Figma, I needed to answer a foundational question: who exactly are we designing for, and what does their world look like?
Fleet management isn't a single vertical. It spans six distinct operator types, each with different priorities:
Before touching Figma, I needed to answer a foundational question: who exactly are we designing for, and what does their world look like?
Fleet management isn't a single vertical. It spans six distinct operator types, each with different priorities:
Fleet Type
Fleet Type
Fleet Type
Primary Concern
Primary Concern
Primary Concern
Routes & Tasks (delivery, field service)
Routes & Tasks (delivery, field service)
Route efficiency, on-time performance
Route efficiency, on-time performance
Availability & Capacity (rental, carpool)
Availability & Capacity (rental, carpool)
Utilization rates, idle time
Utilization rates, idle time
Fixed Schedule (transport, healthcare)
Fixed Schedule (transport, healthcare)
Regulatory adherence, scheduling
Regulatory adherence, scheduling
Heavy Logistics (long-haul trucking)
Heavy Logistics (long-haul trucking)
Fuel cost, driver hours
Fuel cost, driver hours
Heavy Equipment (construction)
Heavy Equipment (construction)
Asset location, maintenance cycles
Asset location, maintenance cycles
Government & Municipal
Government & Municipal
Public accountability, compliance
Public accountability, compliance
The first strategic decision: which vertical to design for?
The answer wasn't "pick one" — it was more valuable to design a modular dashboard infrastructure that works across all of them. Ambitious, but achievable if I focused only on what's truly universal.
The first strategic decision: which vertical to design for?
The answer wasn't "pick one" — it was more valuable to design a modular dashboard infrastructure that works across all of them. Ambitious, but achievable if I focused only on what's truly universal.
Use Case Mapping — Finding Universal Ground
Use Case Mapping — Finding Universal Ground
I mapped 14 use cases across six fleet types using a binary scoring system to identify which appear universally, regardless of industry. Three rose to the top with maximum breadth scores of 11/11: Real-time location tracking, Maintenance management, and Event & exception alerts.
I mapped 14 use cases across six fleet types using a binary scoring system to identify which appear universally, regardless of industry. Three rose to the top with maximum breadth scores of 11/11: Real-time location tracking, Maintenance management, and Event & exception alerts.

Route planning scored high in logistics, but it's largely a solved problem — Google Maps Platform already handles multi-stop optimization in real time.
Route planning scored high in logistics, but it's largely a solved problem — Google Maps Platform already handles multi-stop optimization in real time.
Competitive Analysis
The 50% of the US Market
Competitive Analysis
The 50% of the US Market
The top 10 fleet management platforms control roughly 50% of the US market. I narrowed focus to the six that are software-led (vs. hardware-led):
The top 10 fleet management platforms control roughly 50% of the US market. I narrowed focus to the six that are software-led (vs. hardware-led):
Geotab
Largest market share (4.5M+ users, 130 countries). Custom reports and deep integrations. Interface considered cumbersome, steep learning curve.
Geotab
Largest market share (4.5M+ users, 130 countries). Custom reports and deep integrations. Interface considered cumbersome, steep learning curve.

Samara
#2 globally, 84% user satisfaction vs. Geotab's 70%. Strength: cleanest UI in the market, separate safety inbox. Weakness: doesn't scale to complex fleets (can't set precise departure times per driver in route planning).
Samara
#2 globally, 84% user satisfaction vs. Geotab's 70%. Strength: cleanest UI in the market, separate safety inbox. Weakness: doesn't scale to complex fleets (can't set precise departure times per driver in route planning).

Verizon Connect
Acquired by Geotab in 2025. Strength: visually beautiful, Google Maps-style interface = zero learning curve. Weakness: feature overload, GPS updates every 30 seconds (vs. 1-3 seconds for Motive/Samsara) — the map "jumps" rather than flows.
Verizon Connect
Acquired by Geotab in 2025. Strength: visually beautiful, Google Maps-style interface = zero learning curve. Weakness: feature overload, GPS updates every 30 seconds (vs. 1-3 seconds for Motive/Samsara) — the map "jumps" rather than flows.

Fleetio
$1.5B valuation, 1M+ vehicles. Strength: easy maintenance calendar (color-coded by expiry). Weakness: no built-in GPS — always requires two screens, never a complete picture in one place.
Fleetio
$1.5B valuation, 1M+ vehicles. Strength: easy maintenance calendar (color-coded by expiry). Weakness: no built-in GPS — always requires two screens, never a complete picture in one place.

Use Case Mapping — Finding Universal Ground
Use Case Mapping — Finding Universal Ground
After analyzing all six platforms, one pattern became impossible to ignore: every platform gives you data, but none of them give you a decision.
After analyzing all six platforms, one pattern became impossible to ignore: every platform gives you data, but none of them give you a decision.
The common ground was clear — map-first layouts, color-coded vehicle status, a side-by-side list and map view. What's missing is where the real opportunity lies.
No platform detects conflicts across modules — if a vehicle's insurance expires before a scheduled trip, nothing flags it. Alerts tell you what happened, not what's about to happen. And when a notification does appear, resolving it means navigating away to a different screen entirely.
That gap between information and action became the core design opportunity.
User Research
User Research
Methodology Note
Direct user interviews weren't available within the project timeline. Instead, I conducted systematic analysis of public user feedback: G2 and Capterra reviews for all six platforms, Reddit communities (r/fleetmanagement, r/logistics), LinkedIn posts from fleet managers and industry forums.
This approach has limitation, but for identifying recurring pain patterns, it's highly effective.
On cognitive overload
On cognitive overload
"I don't know what's urgent. Too many variables, no system to surface what needs attention right now."
"I don't know what's urgent. Too many variables, no system to surface what needs attention right now."
On fragmented data
On fragmented data
"I'm making decisions with a partial picture. Data comes from GPS, Excel, emails, maintenance logs, driver reports. I never have the full picture."
"I'm making decisions with a partial picture. Data comes from GPS, Excel, emails, maintenance logs, driver reports. I never have the full picture."
"I find out about the issue when the vehicle is already broken down on the highway."
"I find out about the issue when the vehicle is already broken down on the highway."
On under-utilization
On under-utilization
"I'm not losing money in one big way. I'm losing a little money in many small ways I can't see."
"I'm not losing money in one big way. I'm losing a little money in many small ways I can't see."
"I have vehicles sitting idle and I don't know it. I find out after it costs me."
"I have vehicles sitting idle and I don't know it. I find out after it costs me."
On compliance
On compliance
"The vehicle left for the trip. The insurance expired yesterday."
"The vehicle left for the trip. The insurance expired yesterday."
"Licenses, insurance, and inspections are managed separately from our scheduling. There's no connection."
"Licenses, insurance, and inspections are managed separately from our scheduling. There's no connection."
On driver behavior
On driver behavior
"Our biggest concern is accident risk management. One incident can damage our reputation with clients. We have data on driving behavior but don't know what to do with it."
"Our biggest concern is accident risk management. One incident can damage our reputation with clients. We have data on driving behavior but don't know what to do with it."
The dashboard needed to answer one core question: "What will cost me money or credibility if I don't act on it today?"
The dashboard needed to answer one core question: "What will cost me money or credibility if I don't act on it today?"
Ideation
With the research findings in hand — competitive gaps, pain points, and 14 potential features — I ran a structured ideation session to prioritize what to build and why.
Four key decisions came out of it:
Conflict detection as the core differentiator
Every competitor handles alerts in isolation. No one connects insurance expiry, maintenance schedules, and upcoming trips into a single warning. That's the gap — and closing it means being first to offer something with direct business value that becomes harder to leave once your data is in.
Inline resolution
The pattern across all competitors: alerts exist, but resolving them means navigating away. Every context switch is friction. The alert card itself should be the resolution surface.
KPIs framed in cost, not metrics
Utilization percentages don't move decisions. Idle cost does. The dashboard needs to show managers what underperformance costs — something they can bring to a CFO.
Mobile as a fallback, not a replica
Fleet managers don't always have a replacement. When they're away from their desk, mobile becomes the fallback — and the primary question they'll ask is "where are my drivers and is anything wrong?" Mobile should answer that: map-first, with active issues surfaced immediately.
These four decisions shaped everything that followed in the design phase.
Solutions
The Map as Home: Where
Every Session Starts
The Map as Home: Where Every Session Starts
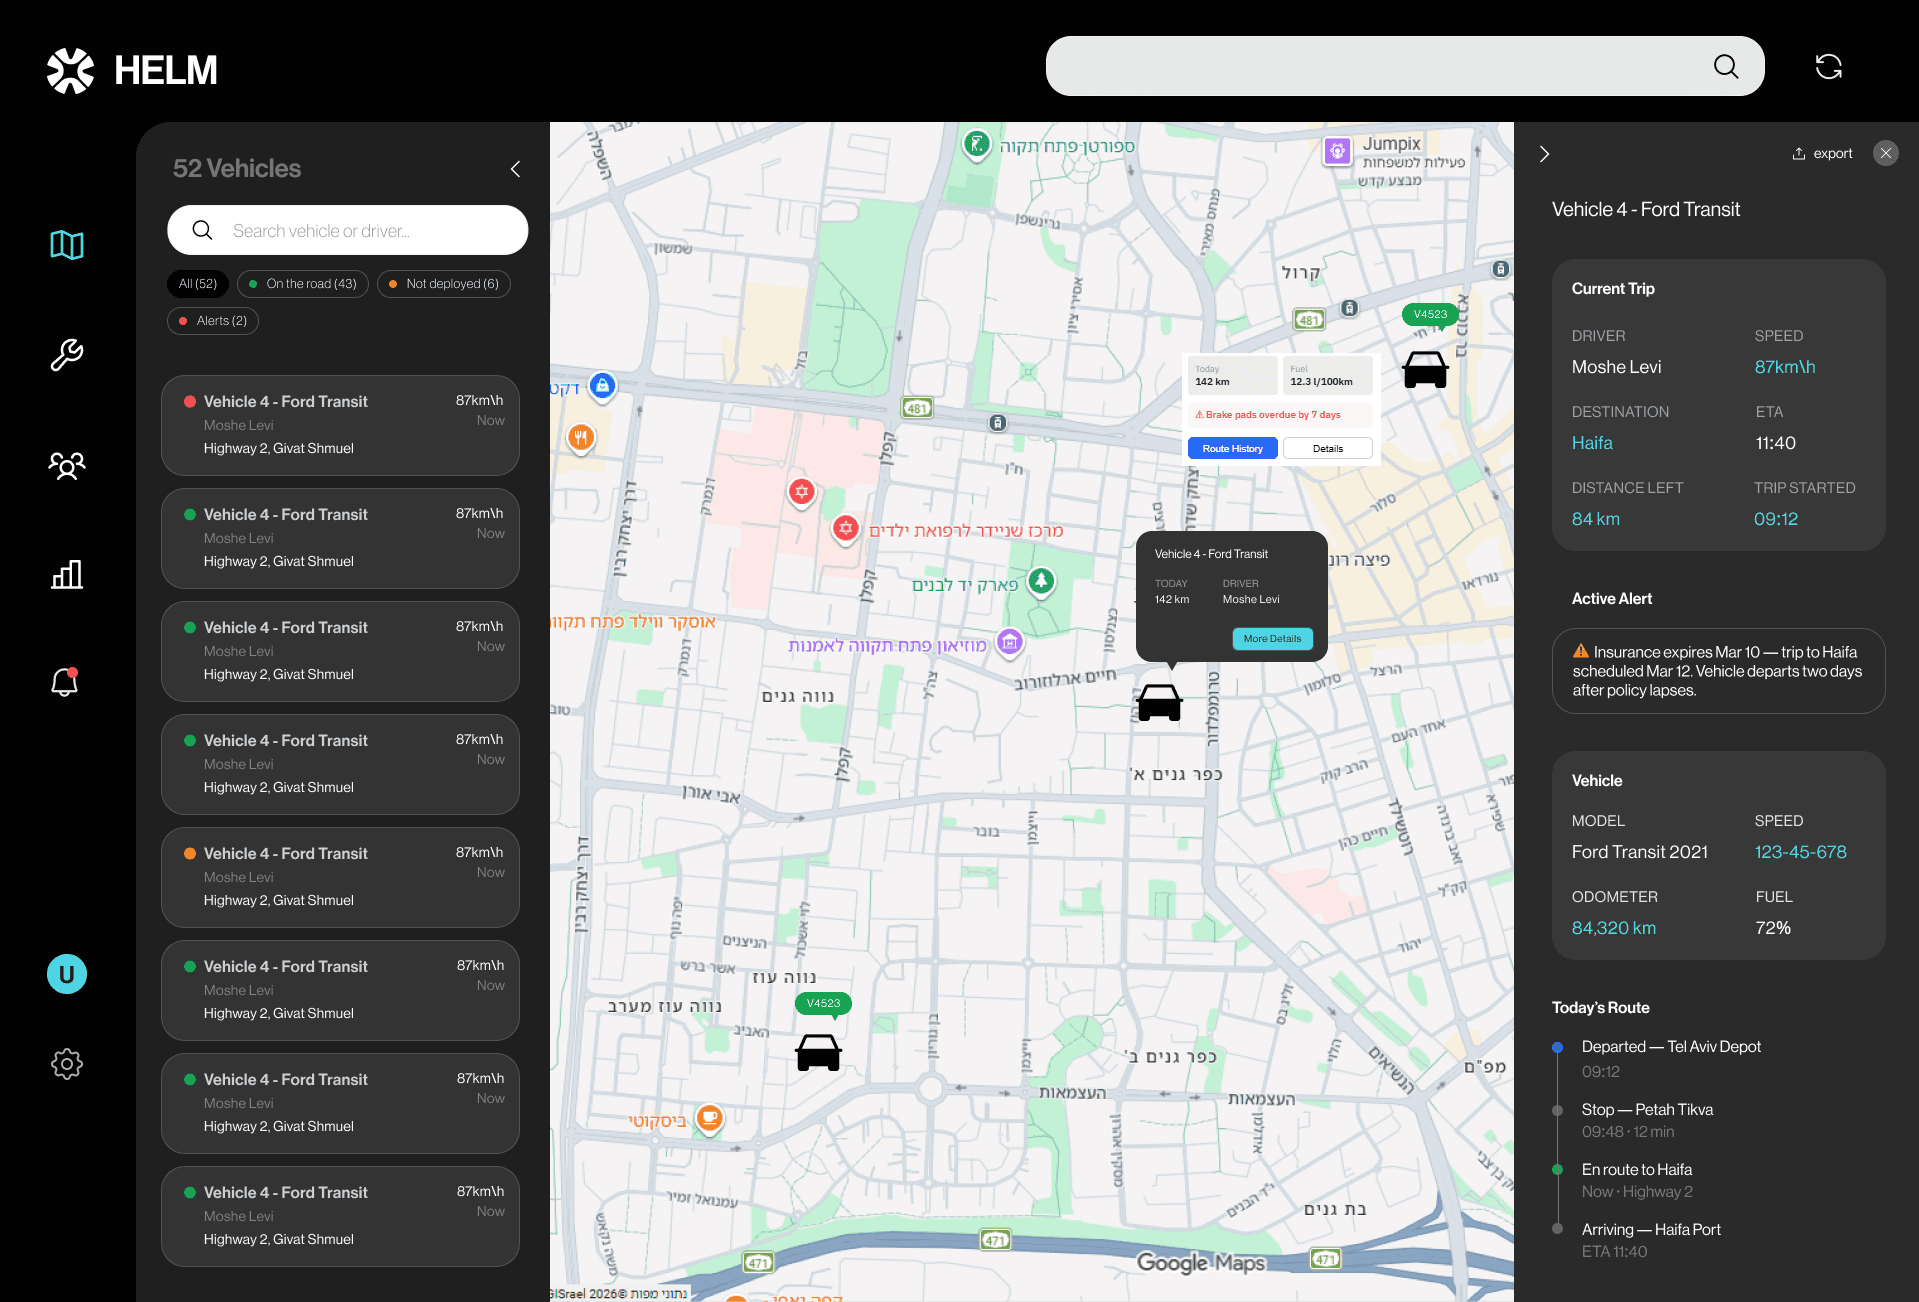
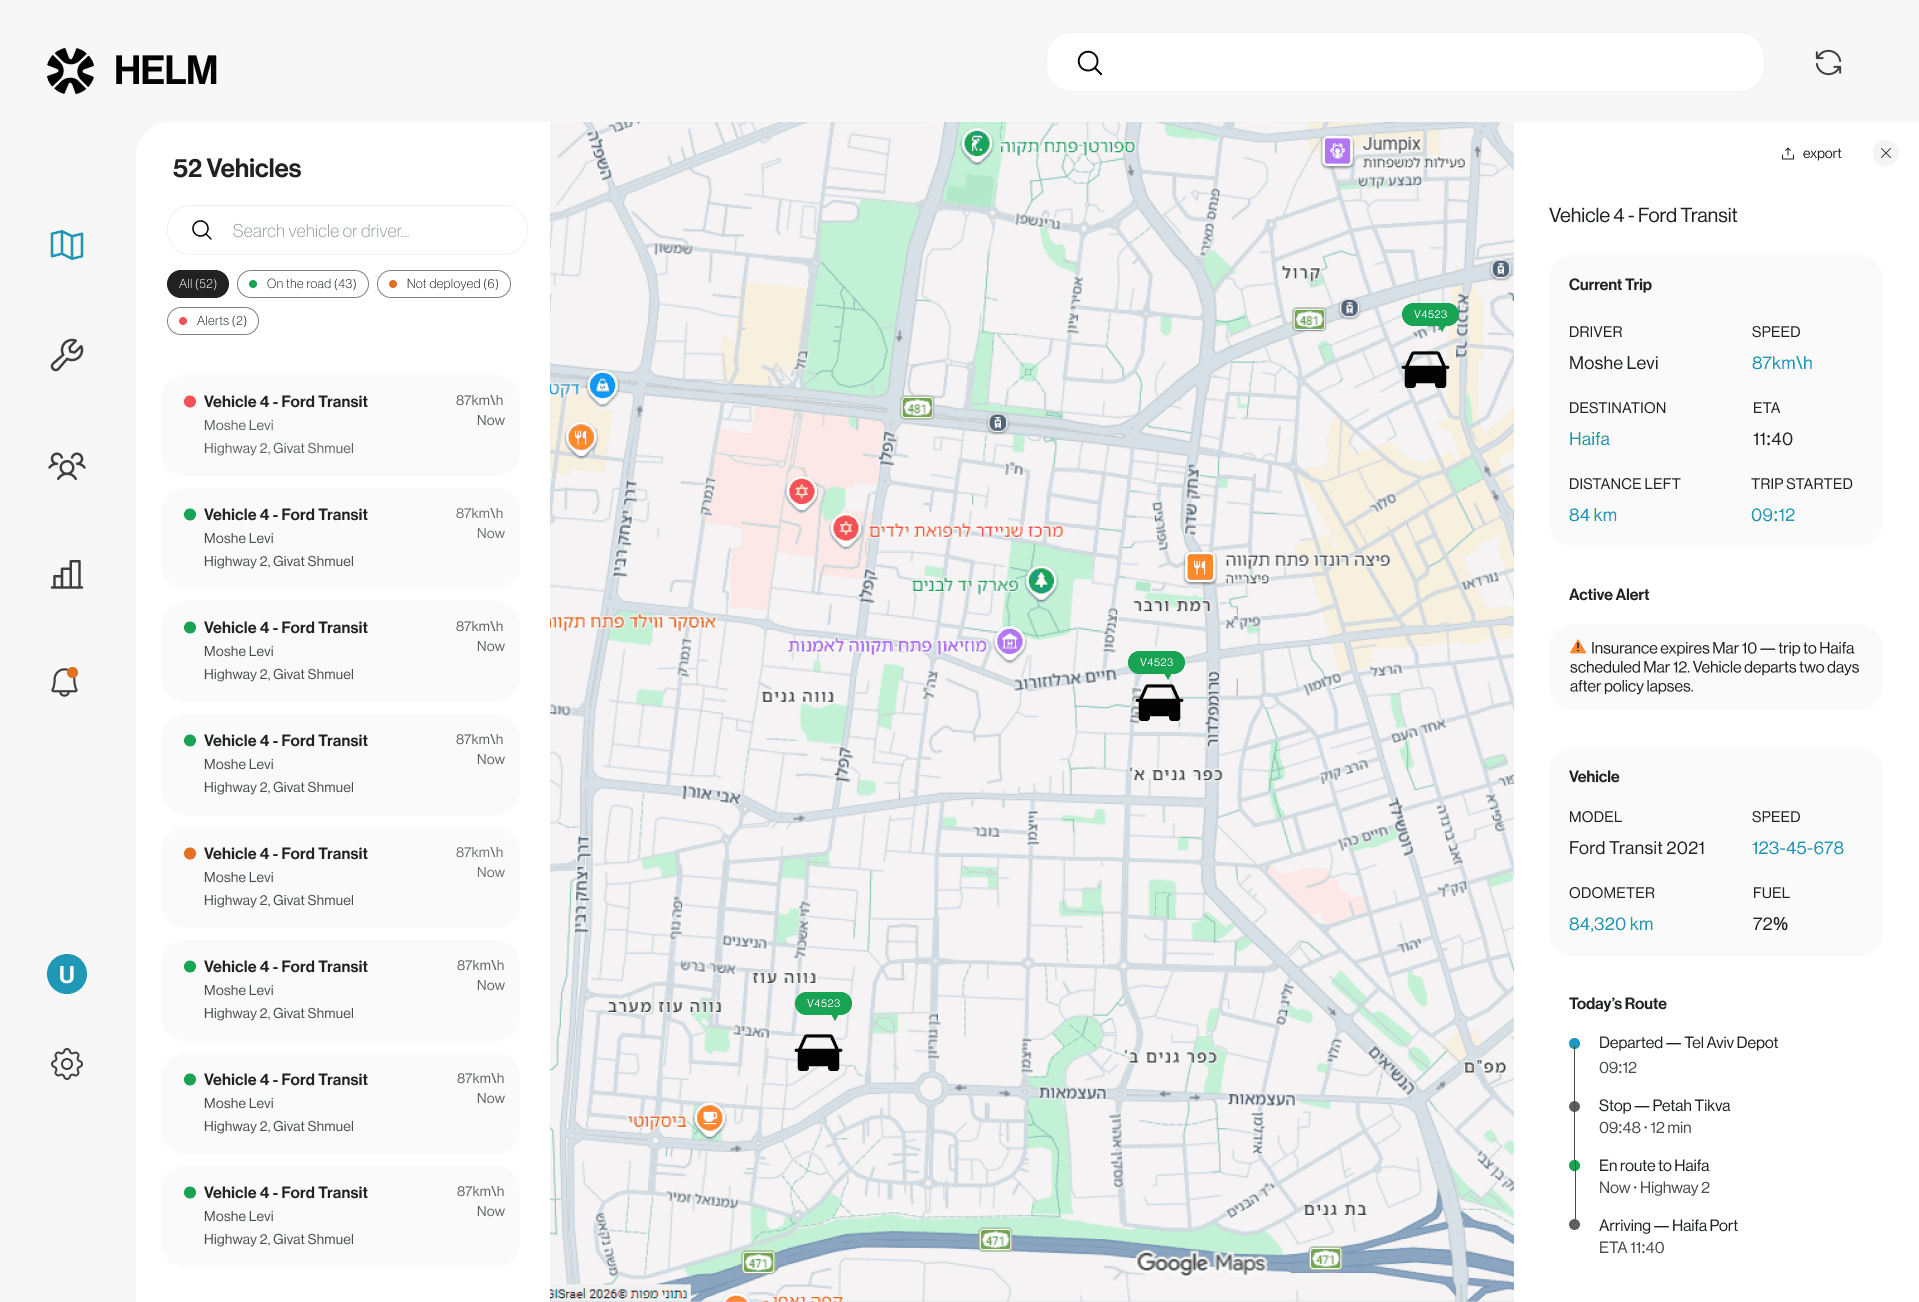
Research confirmed it. Fleet managers open their day with one question: "Where is my fleet right now?" Not what alerts exist, not what the KPIs say — just: are vehicles moving, are they where they should be, is anything visibly wrong?
The map is the entry point, it answers that question immediately. This is best practice, and that's how the manager manage his fleet in routine.
In case of identifying problems from cross data, a side panel opens with an active alert: insurance expires March 10, but a trip to Haifa is scheduled for March 12. The manager clicks the alert and lands directly on the relevant row in the Maintenance screen — highlighted, ready to act. One click to renew.
In case of identifying problems from cross data, a side panel opens with an active alert: insurance expires March 10, but a trip to Haifa is scheduled for March 12. The manager clicks the alert and lands directly on the relevant row in the Maintenance screen — highlighted, ready to act. One click to renew.
A manager isn't always at his desk, and it doesn't make sense for him not to have the option to manage - that's why I also created a mobile version. It has mobile-friendly features, like "call the driver", less complex data with decisions that aren't immediate.
A manager isn't always at his desk, and it doesn't make sense for him not to have the option to manage - that's why I also created a mobile version. It has mobile-friendly features, like "call the driver", less complex data with decisions that aren't immediate.
676
676
Prevent errors through
cross-referencing data
Making AI Recommendations Useful
Making AI
Recommendations Useful
Problem
Managers reported spending 30–45 min/day manually cross-checking insurance, maintenance, and trip schedules across separate tabs
No platform connected expiry dates to scheduled trips — every conflict was discovered reactively, after the vehicle had already departed
Idle vehicles were invisible until they showed up as cost overruns at month-end
Solution
A dedicated decision surface — not a homepage, not an alert feed. A prioritized queue of conflicts that need a resolution before vehicles move.
Two sections: Act Now (conflicts with real consequences today) and This Week (predictive — building toward a conflict)
Each card has exactly one primary action. No ambiguity about what to do next.


Conflict Prevention, Not Just Tracking
Unified Filtering System
Unified Filtering System
Problem
Maintenance screens across all reviewed platforms sorted by last service date
No platform cross-referenced maintenance expiry with upcoming trip schedules
Managers discovered compliance issues only when vehicles were flagged at inspection — after the trip
Solution
Table sorted by conflict status, not date
Conflict engine re-evaluates in real time — when a new trip is created, all vehicle statuses are rechecked
A vehicle moves from "This Week" to "Act Now" the moment a conflicting trip is scheduled


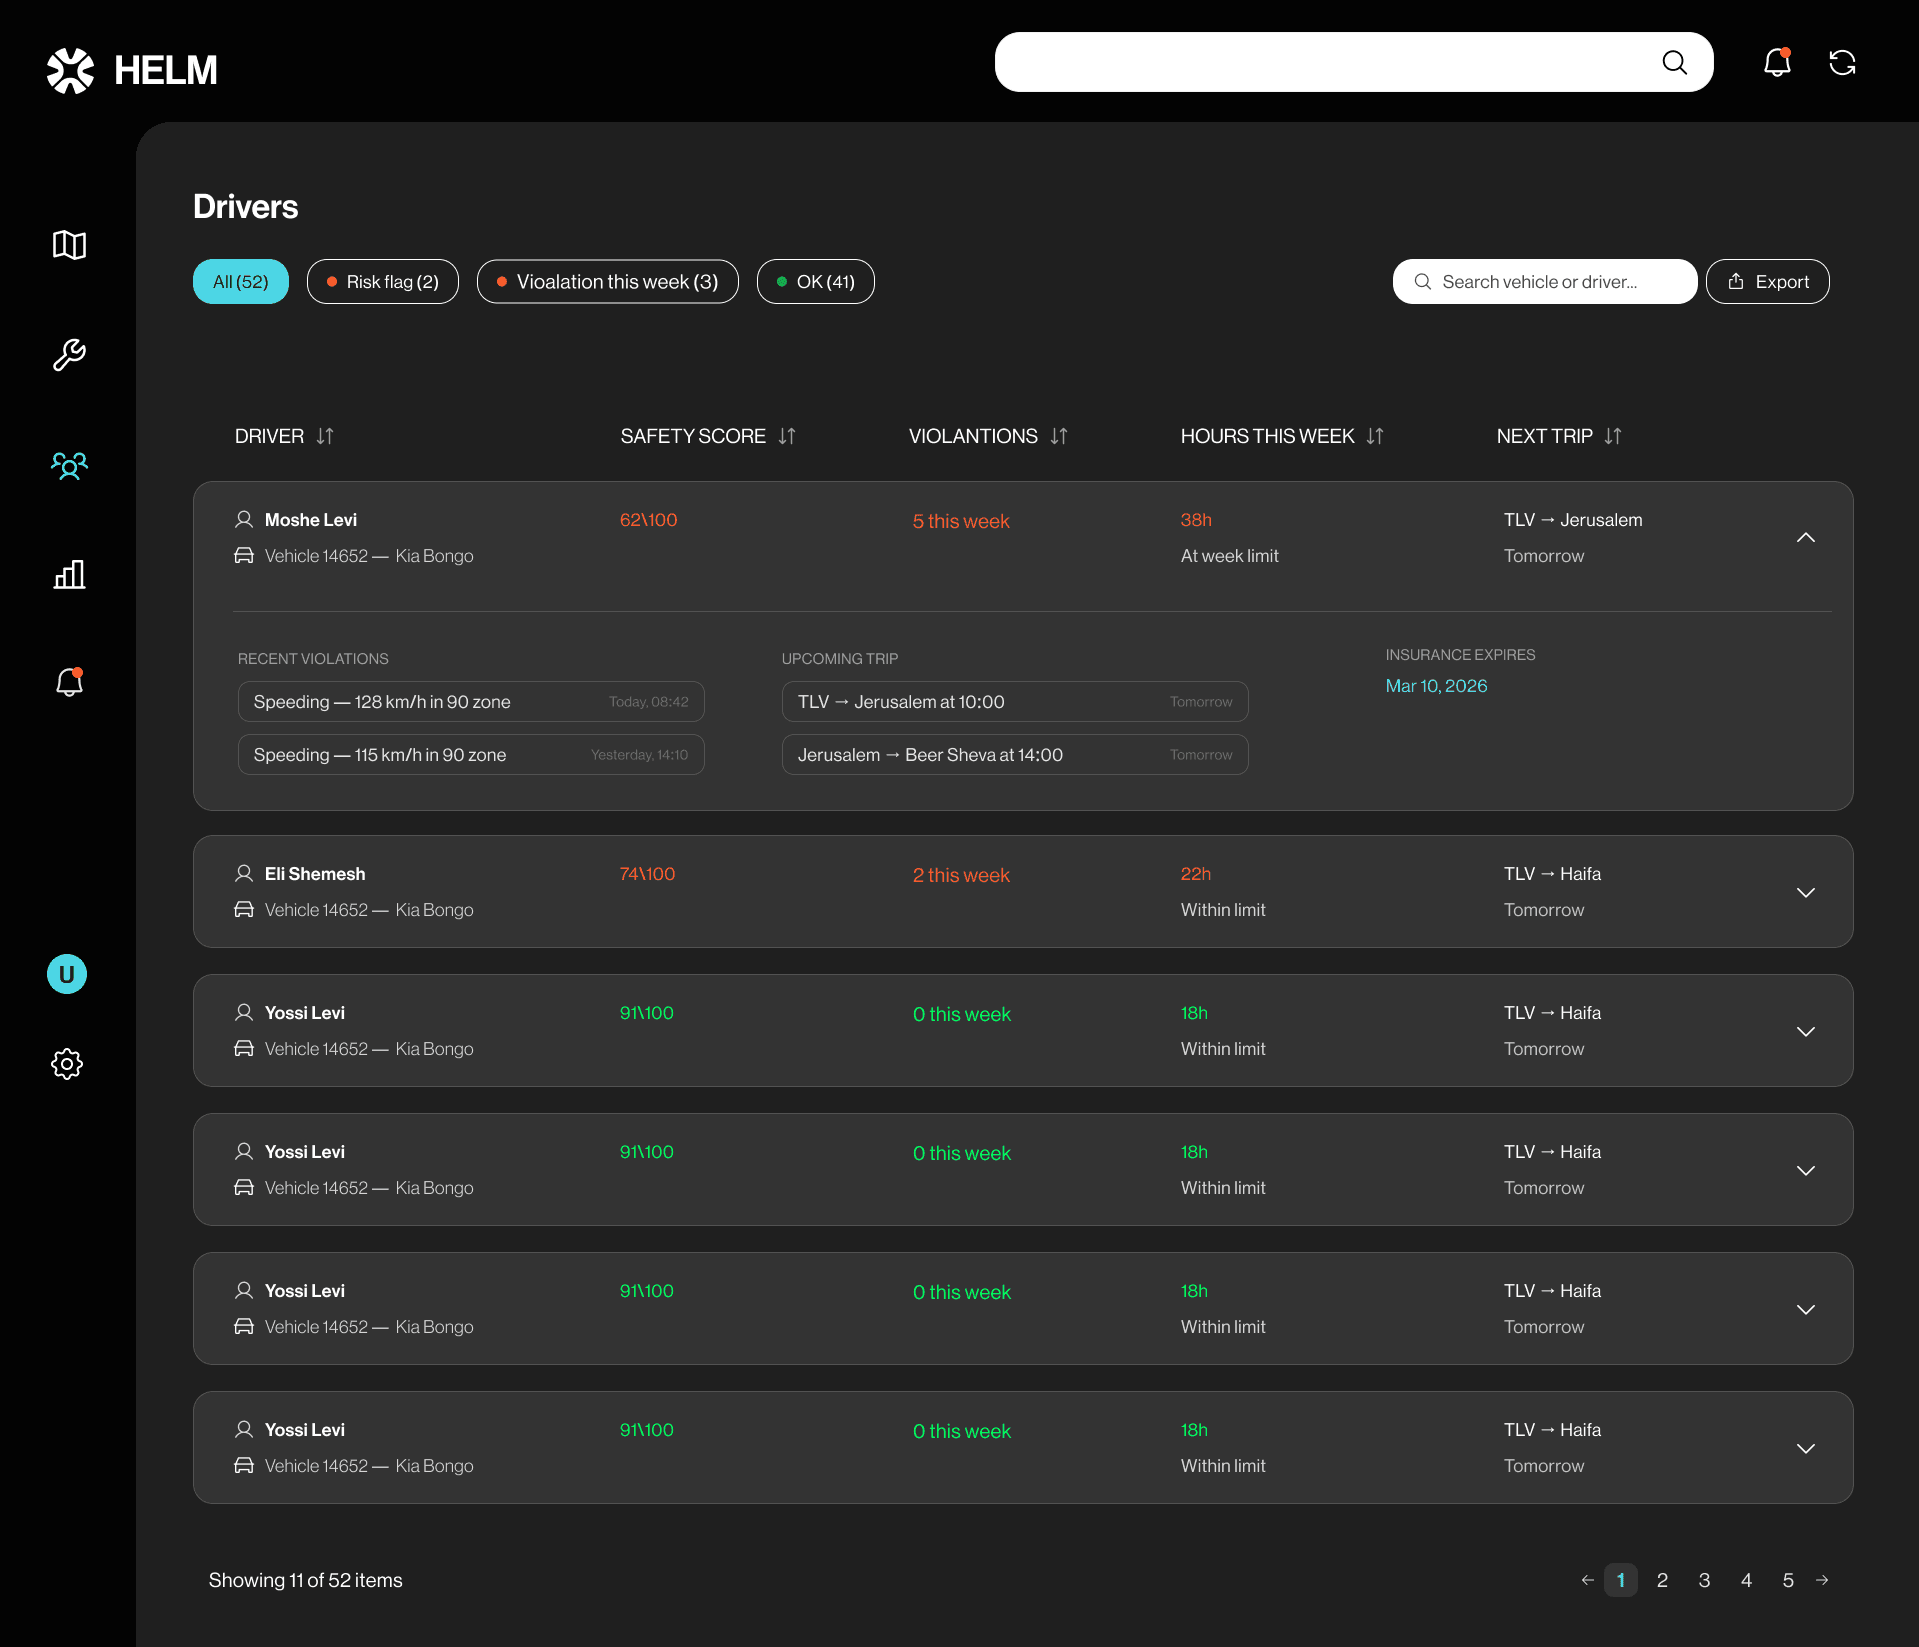
From Score to Pattern
Unified Filtering System
Unified Filtering System
Problem
Event alerts (vehicle leaving a permitted zone, driving outside allowed hours) are one of the three most common fleet use cases — but every platform treats them as individual incidents
Managers have data on driving behavior but don't know what to do with it
A single violation tells you what happened. It doesn't tell you whether it's a pattern, a route problem, or a driver problem
What the dashboard can and can't do
Reassigning a trip after a violation is a reaction. It doesn't prevent the next one.
The real question — how do you change driver behavior long-term — involves organizational decisions that a dashboard can't make.
What it can do is surface the pattern clearly enough that whoever needs to act has the information to do so.
Solution —two layers
Dashboard surfaces patterns — data, trends, and conversations with drivers after the fact, for follow-up. But patterns alone don't stop a violation while it's happening.
Live push notifications sent to dashboard or mobile stop a violation from continuing — catching drivers in the act. A violation happens, a GPS sensor or fuel card fires an alert, and the manager knows within seconds.
The deterrent is the driver knowing that the moment they deviate, their manager is already on the phone.

KPIs to Root Cause
Unified Filtering System
Unified Filtering System
Problem
Every platform showed KPI numbers. None traced them to a cause.
Managers described receiving monthly cost reports they couldn't act on — "the number is red, but I don't know which vehicles or depots caused it"
Idle cost in particular was reported as a persistent blind spot
Solution
Total Preventable Costs accordion connects numbers to specific depots and vehicles
Metrics are cost-framed, not percentage-framed (₪ not %) — so they're CFO-ready
Clicking a cost line routes directly to the notification screen, filtered to that depot


Design Rationale
Design Rationale
Why map-first?
The original hypothesis was to open on the notification as a summary feed — lead with the product's differentiator. Research said otherwise: every manager's first question is "where are my vehicles?" Spatial orientation comes before action. The map became the primary screen.
Why map-first?
The original hypothesis was to open on the notification as a summary feed — lead with the product's differentiator. Research said otherwise: every manager's first question is "where are my vehicles?" Spatial orientation comes before action. The map became the primary screen.
Why keep a separate notification screen?
The map has one limit: it surfaces conflicts one vehicle at a time. When a manager needs to review everything open and decide what to act on first, a spatial view doesn't help. The notification screen solves that — it's a priority queue for the shift from monitoring to deciding. Two views of the same data, for two different moments in the same workday.
Impact
Teams validated AI in real-time and caught when assumptions broke. The system learned from reality, not just history.
Why keep a separate notification screen?
The map has one limit: it surfaces conflicts one vehicle at a time. When a manager needs to review everything open and decide what to act on first, a spatial view doesn't help. The notification screen solves that — it's a priority queue for the shift from monitoring to deciding. Two views of the same data, for two different moments in the same workday.
Why both dark and light mode?
Fleet managers work in different environments — office desks, depot control rooms, outdoors next to a vehicle. Light mode is more readable under fluorescent lighting; dark mode reduces eye strain across long shifts on multiple monitors; outside in direct sun, light mode wins against glare.
Impact
Teams validated AI in real-time and caught when assumptions broke. The system learned from reality, not just history.
Why both dark and light mode?
Fleet managers work in different environments — office desks, depot control rooms, outdoors next to a vehicle. Light mode is more readable under fluorescent lighting; dark mode reduces eye strain across long shifts on multiple monitors; outside in direct sun, light mode wins against glare.
Why mobile?
Fleet managers aren't always at a desk — and the fleet doesn't stop when they step away. Without a mobile option, there are two alternatives: leave the fleet unmonitored, or hire an additional shift manager to cover the gap. Both cost more than building for mobile.
Mobile exists for continuity — not to replace the desktop, but to make sure management doesn't stop when the manager moves. It's scoped to immediate actions only: what's happening now, what needs a response now.
Impact
Teams validated AI in real-time and caught when assumptions broke. The system learned from reality, not just history.
Why mobile?
Fleet managers aren't always at a desk — and the fleet doesn't stop when they step away. Without a mobile option, there are two alternatives: leave the fleet unmonitored, or hire an additional shift manager to cover the gap. Both cost more than building for mobile.
Mobile exists for continuity — not to replace the desktop, but to make sure management doesn't stop when the manager moves. It's scoped to immediate actions only: what's happening now, what needs a response now.
As a solo designer working directly with developers, I needed a system that would maintain consistency across all screens without constant oversight.
I applied Atomic Design methodology—building from foundational atoms (colors, typography, icons), through functional molecules (inputs, stat displays, buttons), to complete organisms (navigation, tables, KPI panels).
Impact
Teams validated AI in real-time and caught when assumptions broke. The system learned from reality, not just history.
What Needed Fixing
Initial status bar
used only color to indicate urgency — accessibility failure for color-blind users. Fixed: added text labels (URGENT, LIVE MAP) alongside color.
Alert card
collapsed state - initially showed too little information, causing users to expand every card to assess priority. Fixed: collapsed state now shows vehicle + driver + headline, enough to triage without expanding.
KPI screen
idle cost chart - initially showed percentage. Revised to show currency value — "a fleet manager can't take a percentage to their CFO."
Impact
Teams validated AI in real-time and caught when assumptions broke. The system learned from reality, not just history.
Initial status bar
used only color to indicate urgency — accessibility failure for color-blind users. Fixed: added text labels (URGENT, LIVE MAP) alongside color.
Alert card
collapsed state - initially showed too little information, causing users to expand every card to assess priority. Fixed: collapsed state now shows vehicle + driver + headline, enough to triage without expanding.
KPI screen
idle cost chart - initially showed percentage. Revised to show currency value — "a fleet manager can't take a percentage to their CFO."
As a solo designer working directly with developers, I needed a system that would maintain consistency across all screens without constant oversight.
I applied Atomic Design methodology—building from foundational atoms (colors, typography, icons), through functional molecules (inputs, stat displays, buttons), to complete organisms (navigation, tables, KPI panels).
Impact
Teams validated AI in real-time and caught when assumptions broke. The system learned from reality, not just history.
Reflection
Impact & Outcomes
Impact & Outcomes
The real design challenge is filtering, structuring, and making data accessible to the person who needs to act on it.
Fleet management is a proxy for a broader design problem: systems that collect enormous amounts of data and then abandon users to make sense of it alone.
The goal of Helm was to give fleet managers back the ability to step out of pure firefighting — and into planning, prevention, and control.